
South Africans’ Real Net Wealth Shrunk R132 Billion In The Third Quarter Of 2018
The purchasing power (real value) of South African households’ net wealth decreased by R131.7 billion in the third quarter of 2018 (Q3 2018) - as they took on more debt, while at the same time, their assets diminished in value. The loss in asset value occurred despite the economy exiting a recession and growing at a pace of 2.2% in Q3 2018.
As economic growth normally contributes to (household) real asset growth, the “asset-declining and asset-stagnating nature” of South Africa’s economic growth over the past five years exposed just how vulnerable the economic structure really is – as only one hiccup can cause the whole foundation to start crumbling.
The decline in real household net wealth during Q3 2018 was brought about by a decrease of R122.4 billion in the real value of household assets compared to Q2 2018, while the real value of their outstanding debt and accounts increased by R9.3 billion.
The decreasing value of household assets can be ascribed to the declining value of their financial assets, which mainly consist of the value of their retirement funds and investments. At the same time, the increase in real household debt was driven by instalment sales, personal loans, and credit card debt.
The non-performance of household wealth is concerning – as it contributes to slower economic growth and job creation, as well as an increasing probability of households in the middle- to upper-middle income groups having insufficient money to retire at an acceptable standard of living. This, in turn, will make the economy even more fragile and sensitive to negative shocks.
Household Net Wealth
Consciously or subconsciously, households’ financial goal is working towards increasing their net wealth.
The real value of their net wealth is calculated by subtracting the real value of their liabilities (mostly their outstanding credit and other debts) from the real value of their assets (consisting mostly of the real values of their savings in retirement instruments, financial investments and residential properties).
Households grow their wealth by accumulating assets and reducing their outstanding debt over time. They seize opportunities and use instruments such as their education, skills, experience and income to save and grow their assets, incur debts (to preferably finance asset acquisitions such as property) and then repay such debts to reduce their liabilities.
Using South African Reserve Bank numbers as benchmark, Momentum/Unisa estimates that the real value of households’ net wealth amounted to R7 006.6 billion at the end of Q3 2018. Disappointingly, however, this is R131.7 billion less than in Q2 2018 – and also R73.8 billion less than in Q1 2015. This means that the real value of household wealth failed to grow for almost four years.
The situation is even worse when expressing household net wealth as a percentage of their gross income. It declined sharply to 273.8% in Q3 2018 from 279.5% in the previous quarter. However, one needs to go back a decade to realise the severity of the situation. In Q1 2008, just before the Great Recession, the ratio used to be 293.5%. During the following 42 quarters, this level was exceeded only three times. This means that household net wealth failed to sustainably recover to pre-recession levels (see Figure 1).
This situation can be attributed to mainly the non-performance of household assets, as their debt increased at a slow pace.
Household Assets
The real value of household assets decreased by R122.4 billion to an estimated R8 458.6 billion over the quarter to the end of Q3 2018. This represents a decline of 5.6% over the quarter, following an increase of 2.0% in the previous quarter.
The declining real value of household assets can be attributed to the non-performance of some financial asset classes, negatively affecting the real value of households’ retirement funds and investments.
For instance, the real JSE All Share Index (ALSI) declined by an annualised 17.3% in Q3 2018 compared to Q2 2018, while the real All Bond Index (ALBI) was down 2.4%. Contrastingly, the real value of deposits grew at an annualised pace of 4.3% compared to Q2 2018. The non-performance of the ALSI and ALBI were caused by international and domestic factors.
Internationally, issues such as interest rate increases in the United States of America (USA), the ongoing trade conflict between the USA and China, as well as uncertainty whether Britain’s exit from the European Union will be orderly, contributed to international investors withdrawing their investments from “risky” emerging markets such as South Africa - causing among others, the rand exchange rate to depreciate. This, again, illustrates how vulnerable the South African economy is to foreign developments – and thus the country’s dependency on foreign capital inflows for asset growth.
At the same time, however, South Africa continued to self-inflict wounds to the economy. Although progress was made to strengthen governance at state institutions and reduce corruption, interventions aimed at changing the Constitution to allow for land expropriation without compensation; the inability of Eskom to produce sufficient electricity; and political skirmishes that prevent faster reforms; continued to create uncertainty on financial markets – and therefore limited growth-enhancing investments.
Consequently, household assets as a percentage of gross income declined to 327.8% in Q3 2018 from 333.2% in Q2 2018. However, it is very far away from the 360.0% level achieved a decade ago and again in 2014.
Should real asset growth remain elusive, the proportion of the population that lives in poverty and just above the poverty line will increase over time. This means that the share of the population having to live at a low standard of living in retirement will increase, rather than decrease.
Household Liabilities
Households’ outstanding liabilities increased at an annualised rate of 2.7%, or R9.3 billion in real terms during Q3 2018. As such the real value of household’s outstanding liabilities was estimated at R1 391.9 billion at the end of Q3 2018.
However, this increase was driven by higher debt of an unsecured nature, rather than by asset financing debt such as mortgages. For instance, the real outstanding value of respectively personal loan and credit card debt was 1.1% and 0.9% higher compared to Q2 2018. The outstanding value of real instalment credit was 1.7% higher, driven by an increase in the number of new passenger car sales. Contrastingly, real outstanding mortgages was 1.5% lower compared to Q2 2018.
As for other debt, the national treasury indicated that outstanding municipal accounts owed by households increased to R101.9 billion (in nominal terms) in Q2 2018 (values for Q3 2018 was not yet available at the time of producing this report).
Outlook for the fourth quarter of 2018
Preliminary estimates point to a further decline in the real value of household net wealth during Q4 2018 as their real asset values declined even more – mainly because of share prices tumbling over this quarter, while real house price growth remained negative. This means that real household net wealth in all likelihood declined again in 2018.
Figure 1: Estimates of household balance sheet variables expressed as a percentage of gross income (annual)
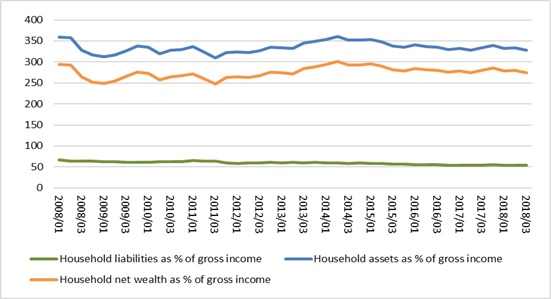
Sources: South African Reserve Bank Quarterly Bulletin December 2018; Own calculations.
Note: Adjustments were effected to historical numbers due to new information received.
Table 2: Estimates of household balance sheet indices (2010 = 100)
|
Quarter |
Liabilities index |
Assets index |
Net wealth index |
|
2014Q2 |
105.2 |
121.8 |
125.8 |
|
2014Q3 |
105.9 |
120.2 |
123.5 |
|
2014Q4 |
107.9 |
121.7 |
125.0 |
|
2015Q1 |
107.5 |
124.0 |
127.8 |
|
2015Q2 |
107.2 |
122.6 |
126.2 |
|
2015Q3 |
108.0 |
121.7 |
125.0 |
|
2015Q4 |
107.7 |
121.6 |
124.9 |
|
2016Q1 |
105.7 |
121.9 |
125.7 |
|
2016Q2 |
106.2 |
121.3 |
124.8 |
|
2016Q3 |
105.0 |
120.9 |
124.6 |
|
2016Q4 |
104.2 |
119.8 |
123.5 |
|
2017Q1 |
104.1 |
121.3 |
125.4 |
|
2017Q2 |
103.5 |
120.6 |
124.6 |
|
2017Q3 |
105.0 |
123.2 |
127.4 |
|
2017Q4 |
107.1 |
126.3 |
130.8 |
|
2018Q1 |
106.7 |
123.8 |
127.9 |
|
2018Q2 |
105.6 |
124.5 |
128.9 |
|
2018Q3 |
106.4 |
122.7 |
126.5 |
Sources: South African Reserve Bank Quarterly Bulletin December 2018; Own calculations.

