
South African households’ net wealth decreased in real terms

Johann van Tonder, Economist & Researcher, Momentum.
Executive summary and highlights
- South African households’ net wealth decreased in real terms (constant 2010 prices) in the third quarter of 2015 (Q3 2015).
- Momentum/Unisa estimates that household real net wealth declined at an annualised pace of7.4% (quarter over quarter seasonally adjusted and annualised - QoQSAA) compared to Q2 2015. This means that real household net wealth declined by R122.8 billion to R6 296 billion (R6.296 trillion) over the quarter.
- This decline was also large enough to wipe out all gains since a year ago (Q3 2014). In Q3 2015 real household net wealth was R29 billion less than a year ago.
- The consequence of this decline is that households - who already had to lower their lifestyle – will have to continue with this process. Moreover, they will have to lower their future lifestyle expectations and review their saving and retirement targets, as well as adjust their other saving and investment goals.
- The main cause of the deterioration in the real value of household net wealth can be ascribed to the real value of household assets declining more than the decline recorded in the real value of household liabilities.
- Momentum/Unisa estimates that the real value of household assets declined at a pace (QoQSAA) of 6.2% or R124.6 billion. The real value of household liabilities declined by R1.8 billion compared to Q2 2015.
- The real value of household assets was adversely affected by a decline in the real value of financial assets invested in shares listed at the JSE, stagnation in households’ contributions to contractual savings products (to annuities, official- and private retirement funds and pension- and group life business), and a slowdown in house price growth.
- Distribution analysis shows that although about 74% of household debt is secured in nature (mortgages and vehicle finance), only 33% of instalments is used to repay secured debt. Conversely, although unsecured debt (credit- and store cards and personal- and micro loans) comprises only 26% of all debt, some 66% of all instalments flow towards repaying the unsecured debt.
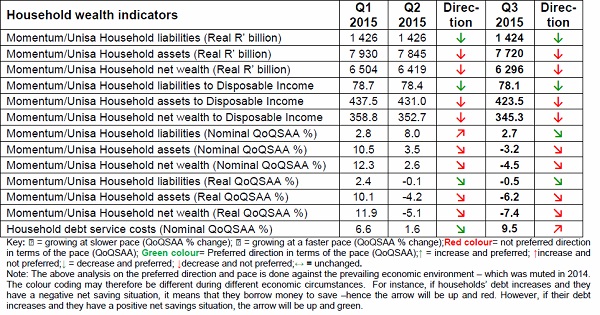
Table 1: Overview of household wealth indicators (quarterly)
1. South african household balance sheet
1.1 Background
The strength or weakness of households’ balance sheets as reflected by their liabilities, assets and net wealth count among some of the most important economic indicators in South Africa. Analysis of the balance sheet provides valuable information on the sufficiency of households’ savings, their retirement prospects, affordability of debt, and their lifestyle expectations. Also, a strong balance sheet is needed for households to be financially well, which, in turn is essential for their resilience to deal with shocks and to contribute to a robust economy. In contrast, weak or declining household net wealth makes strong economic growth and employment virtually impossible.
This household wealth report is constructed around the above-mentioned balance sheet measures, with a specific focus on the third quarter of 2015 (Q3 2015). Additional statistics are provided in the annexure.
2. South African household net wealth
South African household net wealth decreased further in Q3 2015 following a decline in Q2 2015.
Alarmingly, the pace of decline accelerated during Q3 2015, while the decline occurred in both current and constant (2010) prices .
The value of households’ net wealth declined at an annualised pace of 4.5%, or R95.4 billion, to R8 249 billion (R8.249 trillion) in Q3 2015.
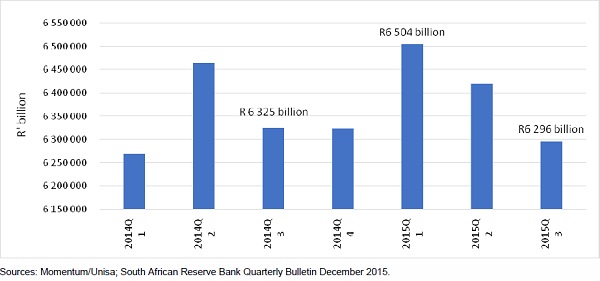
However, both the pace of decline and monetary decrease was larger when household wealth is calculated in constant (2010) prices. The pace of decline accelerated from an annualised rate of 5.1% in Q2 2015 to 7.4% in Q3 2015. In monetary terms, this means that the decline of R85.1 billion in the real value of household net wealth during Q2 2015 was followed by a further decline of R122.8 billion in Q3 2015.The two subsequent declines also mean that the real value of household net wealth was R29 billion or 0.5% lower than a year before (see figure 1).
Figure 1: Value of real household net wealth on a declining path
These declines in the value of South African household net wealth also mean that the ratio of household net wealth to disposable income is much lower than it had been. In Q2 2014 the ratio was 361.8%. However, it was only 345.3% at the end of Q3 2015. This ratio needs to increase towards the 600% to 700% level registered in developed countries for households to become financially well. One of the reasons for this comparatively weak situation in South Africa is the unequal distribution of income that makes it difficult for the majority of households to accumulate wealth. As such they find it difficult to afford financial- and property assets and also lack the opportunity to acquire these assets.
The reasons for the decline in the value of household net wealth can be attributed to a strong decrease in the value of household assets, while their liabilities increased moderately. This will be analysed in the following two sections.
3. South African household liabilities
South African households’ liabilities were estimated at R1 866.1 billion at the end of Q3 2015, up from R1 853.8 billion in Q2 2015.However, household liabilities increased at a slowing annualised rate of 2.7% in Q3 2015 - down from 8% in Q2 2015, mainly as a result of an increase of 50 basis points in the repo rate and overstretched budgets. Compared to a year before, household liabilities was 5.8% higher.
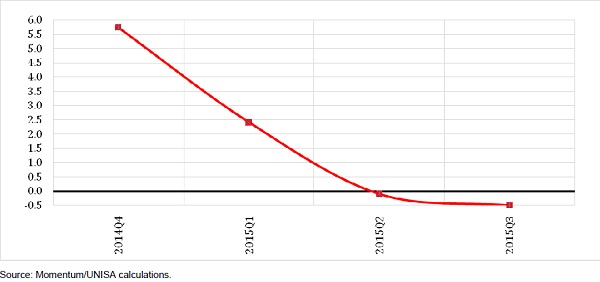
However, when expressed in constant prices, household liabilities virtually stagnated. It was only 1.9% higher compared to Q3 2014. Analysis of the pace at which household borrowing occurred however reveals a dramatic deceleration over time (the past year). In Q4 2014 (between end Q3 2014 and end Q4 2014), households accumulated liabilities at an annualised rate of 5.7%. From there the pace slowed substantially -first to 2.4% in Q1 2015, then -0.1% in Q2 2015 and even further to -0.5% in Q3 2015 (see figure 2). This shows that households are under severe financial pressure as prices are increasing faster than the additional credit they obtained meaning that they have surpassed their affordable debt level.
Moving to the type of household debt, analyses show a situation of “inequality” that presents a unique challenge. Statistics published by the National Credit Regulator (NCR) show that roughly 74% of all debt is secured in nature (mortgages and vehicle finance). However, crude estimates show that only a third of instalments are used to repay secured debt. Conversely, although unsecured debt (credit cards, personal loans, micro loans, store card debt, etc.) comprises only 26% of all debt, some 66% of all instalments flow towards repaying the unsecured debt. Furthermore, as approximations show that instalments comprise about 25% of credit active consumers’ income, it means that 16.5% of their income is used to repay unsecured debt – twice as much as towards repaying secured debt. This means that although South Africans are not unduly acquiring unsecured debt, the unsecured debt they do obtain is very expensive and repayment thereof is eroding consumers’ income - and therefore their ability to save and accumulate assets and wealth.
Figure 2: strong deceleration in the pace of real household liability growth
An example of such un-affordability of unsecured debt can be found in an age analysis (arrears) of the consumers’ outstanding debt. The NCR’s statistics show that while 8.6% of secured debt was in arrears in Q3 2015, the same number for unsecured debt was excessive at 21.2%.
However, NCR statistics also show a decline in the amount, number of consumers and number of accounts in arrears between Q2 2015 and Q3 2015. The amount of consumer debt in arrears decreased by R12.6 billion - to R192.1 billion in Q3 2015. As a percentage of total outstanding debt, arrears declined from 12.5% in Q2 2015 to 11.8%. Similarly, the number of credit active consumers in arrears declined from 57.2% to 53.9% over the same period. And the accounts in arrears also dropped from 33.9% of all accounts to 32.4%.
The slow growth in debt (and contraction in real terms) and firmer measures taken to reduce arrears and repay debt also contributed to the debt to disposable income ratio declining to an estimated 78.1% in Q3 2015 from 78.4% in Q2 2015.
In sum, during Q3 2015 household’s liabilities were characterised by increasing interest rates, unaffordable instalments on unsecured debt and a high level of arrears.
4. South African household assets
Momentum/Unisa estimates that the value of household assets decreased by R83.1 billion to R10 115 billion (R10.1 trillion) in Q3 2015. This represents a decline of 3.2% (annualised) in Q3 2015.
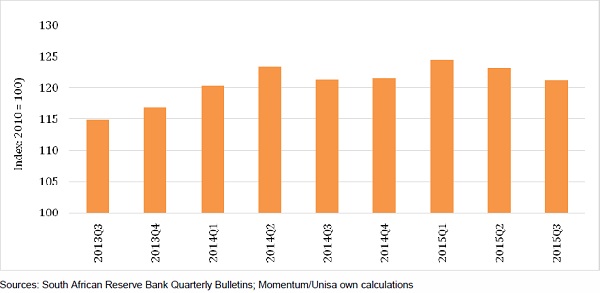
In constant prices, the value of household assets decreased by R124.6 billion to R7 720 billion in Q3 2014– just above the level registered in Q1 2014 (see figure 3). This was 0.04% lower compared to a year ago. Measuring the pace of decline over the quarter reveals an even worse situation. Household assets declined at an annualised pace of 6.2% between Q2 2015 and Q3 2015, following a decline of 4.2% between Q1 2015 to Q2 2015. This means that the value of real household assets was R210 billion lower in Q3 2015 compared to Q1 2015.
During Q3 2015 the value of household assets was mainly affected by the growth – or lack thereof – in the value of financial investments, households’ contributions to retirement funds, the pace of new investments in residential property and the growth in house prices.
The JSE All Share Index (Alsi) – which serves as a proxy for the value of financial investments - was 3.3% lower at the end of Q3 2015 compared to Q2 2015. As the prices of company shares in which savings are invested declined in Q3 2015, it contributed to the decline in the value of household assets.
However, household contributions to annuities, retirement funds and unit trusts supported the value of household assets. Whereas households’ contributions to annuities, public- and private retirement funds remained stagnant at around 8% of adjusted disposable income in Q3, contributions to unit trusts soared. Although no data is available to distinguish between contributions made by households and by other institutions, purchases of unit trusts were 10 times more in Q3 2015 compared to Q2 2015 (Q2 2015 was an exceptionally low month, though).
Another factor supporting the value of household assets was the growth in house prices. According to the Absa House Price Index, house prices was on average 5.2% higher compared to a year ago and 3.64% higher compared to Q2 2015, suggesting that most of the house price growth occurred in Q3 2015. House price growth was driven by large houses that recorded year over year growth of 7.1%, compared to respectively 3.7% and 4.1% in the categories for medium and small houses.
Figure 3: Real household assets at a low level and on a declining trend
However, new investments in residential property were more or less at the same level compared to Q2 2015 and as such did not contribute much towards growing the value of household assets. Reserve Bank statistics show seasonally adjusted and annualised investment in residential property of R56.3 billion in Q3 2015 compared to R56 billion in Q2 2015.
The above developments, but especially the decline in the value of share prices, combined to reduce the ratio of household assets to disposable income to 423.5% in Q3 2015 from 431% in Q 2 2015.
5. Conclusion
The real value of household net wealth declined during Q3 2015. The decline wiped out all net wealth gains since Q1 2014.
This means that households will have to lower their lifestyle expectations and review their financial goals. Moreover, they need to change their financial behaviour as they apportion twice as much money to the repayment of unsecured debt than to contractual savings (contributions to annuities and official- and private retirement funds). In short, households in especially the middle- and high income categories urgently need to cut back on consumption and prioritise savings.
