
South African household wealth index 2016
Full year results for 2016.
Executive summary and highlights
• South African households’ real net wealth declined in 2016.
• Momentum/Unisa estimate that the real net wealth of households declined by R119.2 billion or 1.7% to R7 004.4 billion at the end of 2016.
• At the end of 2016, real net wealth was also R102.5 billion lower than the value at the end of 2014.
• Real net wealth per household is estimated to have declined by R18 382 or 4.3% to R411 941 at the end of 2016.
• Real net wealth per household is now at a similar level as at the end of 2012.
• These developments mean that fewer households will be able to retire with sufficient income to maintain their living standard. They will therefore have to reduce their standard of living once retired.
• In addition, a growing share of households will not be able to cope with the challenges of unexpected or emergency expenses as they don’t possess sufficient liquid financial assets.
• The weakened state of household wealth also has policy implications as the pool available for redistribution is shrinking. It also means that a growing number of households will be dependent on the government for grants, which will put pressure on future taxes to increase.
• The main reason for the decrease in the real net wealth of households can be attributed to the decline in the real value of household assets, while the real value of their liabilities increased slightly.
• The real value of household assets decreased for a number of reasons. This includes borrowing for purposes of consumption rather than for asset accumulation (to purchase property). Analysis shows that households spend almost 21 cents of every R1 of their gross income to repay debt. And about 70% of the 21 cents are used to repay consumption debt, with 30% going towards the repayment of mortgages and vehicle purchases.
• As a result debt repayments and consumption expenditure erode the income available to save and invest for purposes of asset accumulation (i.e. retirement funds, annuities, purchase of property, etc.).
• This situation was exacerbated by a lack of sufficient returns on their investments. The latter can be ascribed to poor economic growth and job creation, a lack of consumer and business confidence, relatively high consumer price inflation and an increasing tax burden.
• For net wealth to start growing again, it is necessary that confidence and stability be instilled in the economy in order to increase the rate of investments, economic growth and job creation.
1. Importance of the south african household balance sheet
Households with a strong net wealth position tend to be financially well. International research has shown that they share common behavioural traits that contributed to them being, or on their way of becoming financially well. Some of these traits include:
• planning and managing their finances well over their lifetimes;
• saving sufficiently for retirement in various instruments;
• having savings to fund emergencies;
• incurring affordable debt, mostly to accumulate assets; and
• having adequate insurance to protect them against potential disruptive unexpected events.
They accomplished the above via proper budgeting, living according to a financial plan and making use of financial expertise to compile the plan and adjust it when necessary.
Financially well households were, among others, able to build a strong balance sheet in the form of a strong net wealth position. Net wealth is calculated by subtracting liabilities (outstanding debt and accounts) from assets (mostly the value of residential property and the value of savings in instruments such as retirement funds and annuities). A strong net wealth position is typically acquired by incurring affordable debt - mostly to accumulate residential and vehicle assets, as well as saving and investing sufficiently towards a customised retirement income and other goals.
Analysis of households’ liabilities, assets and net wealth provides imperative information on the sufficiency of households’ formal savings, their retirement prospects, affordability of debt and expenses, as well as lifestyle expectations. This should inform the policy decisions of the authorities with the purpose of enabling households to build strong household net wealth positions, especially as research has shown that households with strong net wealth positions are more resilient when having to deal with economic shocks. In addition, countries, where the majority of households are working towards strong net wealth positions, are more able to recover from economic shocks, while they also tend to create jobs and grow their economies consistently.
This household wealth report is constructed around the above-mentioned balance sheet measures, with a specific focus on 2016. Additional statistics are provided in the annexure. Note that some of the numbers mentioned in previous reports changed because of adjustments effected (by Statistics South Africa and the South African Reserve Bank) to the official statistics. However, the adjustments did not affect any of the trends.
2. South african household net wealth
The real value of South African households’ net wealth decreased in 2016 compared to 2015. In fact, the real value of household net wealth has been on a declining trend for the past two years. As such, it was lower at the end of 2016 than it was at the end of 2014. The decline was even more severe when expressed in per household terms. Real household net wealth per household was lower at the end of 2016 than it was at the end of 2012.
Momentum/Unisa estimate that the real net wealth of households declined by R119.2 billion or 1.7% throughout 2016 (from R 7 123.4 billion at the end of 2015 to R7 004.4 billion at the end of 2016). At the end of 2016, real net wealth was also R102.5 billion lower than the value at the end of 2014.
Real net wealth per household is estimated to have declined in 2016 - by R18 382 to R411 941 at the end of 2016. This is 4.3% lower than the R430 323 at the end of 2015 and also R4 113 lower than the R416 054 registered at the end of 2012 (see figure 1). The larger decline in real net wealth per household (4.3%) compared to the overall real net wealth (1.7%) can be attributed to the growth in the number of households, while real net wealth declined.
Figure 1: real net wealth per household on a declining trend
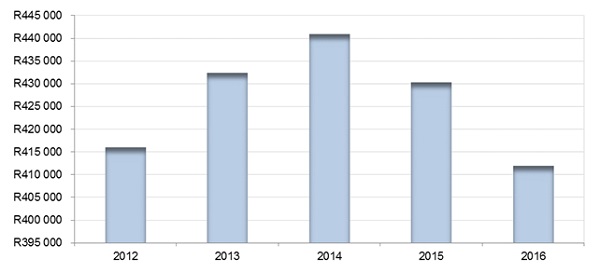
Sources: Momentum/Unisa; South African Reserve Bank Quarterly Bulletin March 2017
The main reason for the decline of R119.2 billion in the real net wealth of households can be ascribed to the decline of R115.7 billion in the real value of household assets, while that of their real liabilities increased by R3.5 billion over the course of 2016. These changes contributed to the ratio of household net wealth to disposable income declining to an estimated 375.3% at the end of 2016 from 385% a year before (end of 2015) and 401.4% at the beginning of 2015.
Of concern, however, are the negative consequences brought about by the decline in the real value of household net wealth. One outcome is that a larger growing number of households will not have sufficient funds for retirement. They will therefore have to lower their standard of living considerably just to make ends meet when retiring (such as moving from owning a house to renting one, or having to deprive themselves of meals, etc.), while at the same time placing a larger burden on the government to increase its social expenditure, with a slower growing tax base.
Another consequence is that they expose themselves to a state of financial unwellness as they don’t provide sufficiently for emergency or unexpected expenses. Such expenses (such as large medical outlays, car accidents or thefts and the loss of income) have the potential to turn a seemingly good financial situation into a nightmare. As such, households normally revert to borrowing more to meet the emergency/unexpected expenses – and in so doing, they have to use a share of their income currently used for something else (such as saving for retirement) to repay the borrowed funds. This normally results in them not having sufficient funds for retirement.
Analysis of the driving forces behind the persistent decline in the value of real net wealth of households revealed a number of factors that contributed to households not accumulating and growing their assets so they can increase their real net wealth. These factors can be attributed to policies implemented by the authorities (fiscal and monetary policy), a non-performing economy, as well as behaviour of households in terms of how they use their income. The net result of these factors is that households sacrificed a growing portion of their savings – that is normally used to accumulate assets and net wealth – in order to consume more and comply with government policies. These factors are:
• Increasing income and wealth taxes that lately have been consuming a growing share of households’ gross income
• Too much debt and higher interest rates which contributed to a larger portion of household gross income being used to repay debt (incurred for consumption purposes)
• Despite higher taxes and debt eroding their gross income, households attempted to maintain their consumption expenditure at levels above the long term average
• As such, they sacrificed their (asset accumulating) savings (social contributions) to for instance retirement funds to be able to pay the higher taxes, debt and consumption (see Figure 2)
Figure 2: Household outlays as a percentage of gross income
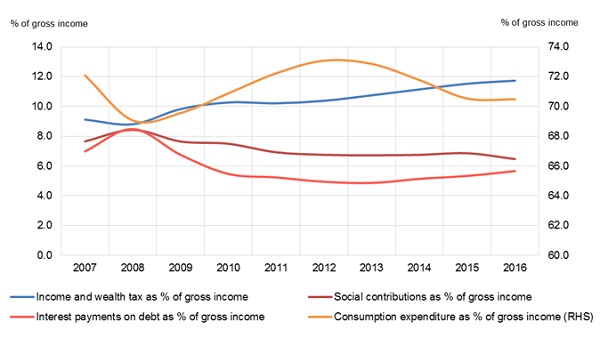
Sources: Momentum/Unisa; South African Reserve Bank Quarterly Bulletin March 2017
These factors will be discussed in more detail in the next two sections.
3. South African household liabilities
According to Momentum/Unisa estimates, the real value of household liabilities increased marginally over the year by - R3.5 billion or 0.3% - to R1 388.6 billion at the end of 2016. Household liabilities consist of their outstanding credit extended to them by banks, non-bank vehicle financiers, retailers, micro-lenders, development finance institutions, educational institutions, telecommunication companies and other lenders, as well as accounts in arrears such as monies owed to municipalities, the South African Revenue Service, etc.
Notwithstanding the small increase in real liabilities, the ratio of household debt to disposable income is estimated to have continued its declining trend - from 74.9% at the end of 2015 to 74.4% at the end of 2016 – mainly as a result of slow credit growth and disposable income increasing slightly more than liabilities. Momentum/Unisa estimates show that this ratio has been on a declining trend since Q1 2008 when it reached a high of about 90%.
However, the debt to disposable income ratio has limited use even though it is used widely. This is because it uses all the outstanding debt that consumers incurred over their lifetime and then comparing it to only one year’s disposable income. It therefore compares apples with pears and as such it should at most be used as an indicator of the level of indebtedness. It cannot on its own be used as an indicator of affordability, or even over-indebtedness.
A better indicator of affordability is the instalment to gross income ratio as it indicates the share of gross income that is used to repay debt. Using data provided by ScoreSharp, the analytical division of Compuscan (one of the four largest credit bureaus in South Africa), Momentum/Unisa estimated this ratio at 20.9% at the end of 2016, meaning that households used almost 21 cents of each R1 of gross income they earned last year to repay debt.
However, if these instalments are predominantly used to repay debt incurred for purposes of consumption it means that households have less money available for savings to build assets and increase their net wealth. This is indeed the case in South Africa as analysis of the distribution of instalments confirmed that households are borrowing to consume rather than to build assets. Of the 21 cents of every R1 gross income that is used to repay debt, only 6 cents (or 30% of instalments) is used to repay mortgages and vehicle loans. The latter two types of debt are acceptable debt as they are used to either build residential assets, or to obtain transport that is used to earn an income. The other 15 cents, or 70% of instalments, however, are used to repay personal loans (mostly used for consumption purposes), clothing and furniture credit/loans, credit cards and telecommunication accounts (cell phones, etc.). Figure 3 shows how the instalments are distributed according to debt type, with 36% of instalments used to repay unsecured loans.
Figure 3: Percentage distribution of instalments by type of debt
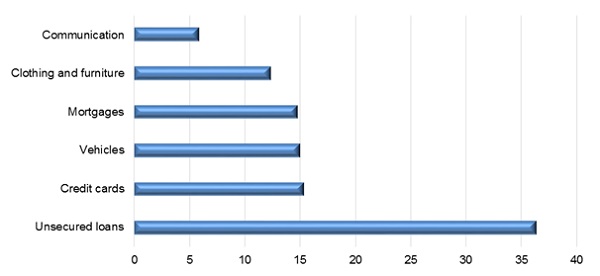
Sources: Momentum/Unisa; ScoreSharp
The above distributional statistics confirmed the analysis mentioned in the previous section, namely that households are borrowing to maintain a high level of consumption. The debt service costs and consumption expenditure, as well as a higher tax burden contributed to less money available for savings and therefore asset accumulation. This will be discussed further in the next section.
4. South African household assets
The real value of household assets is estimated to have decreased by R115.7 billion or 1.4% to R8 393.9 billion over the year to the end of 2016. Household assets mainly consist of non-financial assets such as residential property and financial assets; including the value of savings for retirement and other investments. Financial assets comprise about 64.3% of total assets, while the values saved in retirement funds make up 53.7% of financial assets.
Momentum/Unisa estimates that the real value of households’ residential property stock increased marginally in 2016, but that the real value of financial assets declined further. Moreover, as figure 4 shows, a declining trend in the real growth of prominent household assets seems to have been established over the past three years.
Figure 4: Declining change in the real value of some household assets (year over year percentage change)
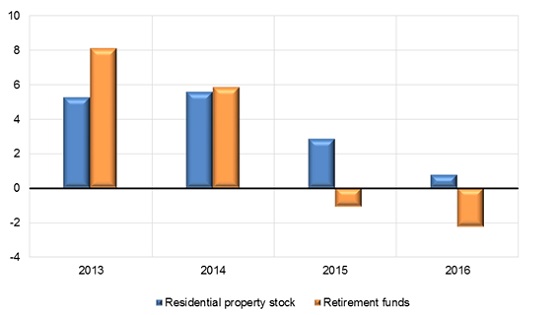
Sources: Momentum/Unisa; South African Reserve Bank Quarterly Bulletin March 2017
The real value of households’ residential property stock is estimated to have increased by 0.8% over the course of 2016. However, this small increase was primarily as a result of new investments in residential assets rather than an increase in house prices. According to the ABSA House Price Index, the real value of house prices decreased by an estimated 1.2% in 2016 compared to 2015.
The real value of financial assets is estimated to have decreased by 2.4% over the year. This is mainly as a result of a decline in the real value of financial assets invested in shares listed on the JSE. For instance, in real terms the JSE All Share Index was 5.7% lower at the end of 2016 compared to a year before.
The real value of households’ assets in retirement funds - that comprises both contributions to and the growth in investment products – was 2.2% lower compared to the end of 2016. This can be attributed to real declines in some asset classes such as shares, but also to falling contributions to employee retirement funds and annuities. Using South African Reserve Bank statistics, Momentum/Unisa estimates that households’ social contributions to employee benefits and annuities declined by 4.4% in real terms over the course of 2016.
With contributions to retirement funds declining and real returns not coming through, this contributed to the real value of household assets declining in 2016 – as mentioned in the previous two sections.
Due to the decline in the real value of household assets and the increase in the number of households, Momentum/Unisa estimates that the real value of assets per household decreased by R20 388 to R493 610 per household over the year to end 2016. Moreover, it was also R23 387 per household lower than at than end of 2012.
5. Conclusion
South African households’ real net wealth decreased by 1.7% in 2016 to a level lower than two years ago. This can mainly be attributed to the real value of household assets declining by 1.4% over the year to the end of 2016. The decline in the real value of household assets can in turn be ascribed to a decline of 2.4% over the same period in the real value of households’ financial assets, of which their investments in retirement funds comprise the largest share.
Real net wealth per household declined by an even larger margin as a result of the number of households growing, while the value of real net wealth declined. Real net wealth per household is estimated to have declined by R18 382 per household to R411 941 at the end of 2016. This is also an estimated R4 113 lower than the R416 054 registered at the end of 2012.
The continuing decline in the real value of assets per household has policy implications in that it will make it difficult for the government to continue with redistribution of income and wealth policies. For such policies to succeed and contribute to faster economic growth and job creation and the reduction of inequality, it is necessary for the real value of household wealth to increase at a speedy rate. This, however, will require a stable rand exchange rate, lower consumer price inflation, stable interest rates, faster economic growth and job creation, higher consumer- and business confidence, less borrowing for consumption purposes and less reliance on income tax rate increases to finance the fiscal deficit.
