
Household net wealth deteriorates further in the second quarter of 2017

Johann van Tonder, Financial Wellness Researcher & Economist at Momentum.
The real value of South African households’ net wealth decreased in the second quarter of 2017 (Q2 2017) to levels last seen in 2014. This crunching blow means that a growing number of households will among others not be able to cope with emergency expenses and also not have a sufficient income in retirement. In short, South African households’ quality of living is in a state of deterioration.
This precarious situation can be ascribed to a self-inflicted slow growing domestic economy that failed to create strong job growth and sufficient returns on household assets. According to numbers provided by Stats SA, the South African economy grew at an average rate of 1.6% over the past five years and only 1.1% over the past three years. The country therefore did not benefit strongly from a world economy that expanded at a much stronger rate of 3.3% over the past five years.
Household net wealth
Momentum/Unisa estimates that the real value of households’ net wealth amounted to R7 007.6 billion at the end of Q2 2017. This is about R10 billion less than at the end of Q1 2017 and also 0.7% lower than a year ago.
The real value of household net wealth is the difference between the real value of households’ assets (consisting mostly of the real values of their retirement funds, other financial investments and properties) and their liabilities (mostly the value of their outstanding credit and other debts).
To obtain a sense of the magnitude of households’ net wealth, it can be expressed as a percentage of their annual gross[1] income. This shows that household net wealth declined to an estimated 279.7% of their gross income in Q2 2017 - from 284.6% in Q1 2017. This is also much lower than the 305.2% reached in Q2 2014.
The reasons behind the pattern of declining household net wealth over the past three years can be ascribed to the real value of household assets declining, while their liabilities remained more or less constant (see Table 1).
Household assets
Over the past three years the real value of household assets declined as a percentage of their gross income - from 364.7% in Q2 2014 to 335.0% in Q2 2017. This can be attributed to mostly the decrease in the real value of households’ financial assets - specifically the real value of their retirement funds, which mainly consist of investments in listed shares and bonds.
However, the decline in the real value of listed shares outpaced the increase in the real value of bonds, which contributed to the decrease in the real value of household financial assets. For instance, the real value of the JSE All Share Index (ALSI) declined by 12.2% over the past three years, while the real value of the All Bond Index (ALBI) increased by only 6.5%.
Over the past year the real JSE ALSI declined by 5.3%, while the real ALBI increased by 3.4%. These changes, as well as a decline in the real value of residential property, contributed to the decrease of R33.3 billion to R8 394.6 billion (at the end of Q2 2017) in the real value of household assets over the past year. These numbers confirm households’ dependence on the financial markets for asset growth.
Household liabilities
In contrast to household assets, the ratio of household liabilities as a percentage of their gross income remained constant at levels of 55% over the past 18 months. However, over a three year period it declined from an estimated 59.5% in Q2 2014 to 55.4% in Q2 2017. This decline was, however, much smaller compared to the decrease in assets – hence the sharp decline in the ratio of net wealth to gross income.
Momentum/Unisa estimates that the real value of outstanding household liabilities increased to R1 386.9 billion in Q2 2017 from R1 372.7 billion in Q1 2017. This is 1.1% higher than in Q2 2016.
The trend of consumers increasingly reverting to non-bank credit continued in Q2 2017. Households’ outstanding credit at banks was 1.4% lower than a year ago in real terms. Contrastingly, their real other liabilities increased by 0.3% over the same period. Consequently, households’ outstanding commitments at non-bank institutions increased to an estimated 23.5% in Q2 2017, which is almost three percentage points higher than the 20.7% registered three year ago.
However, households’ other non-bank liabilities include both credit and arrears. The largest share emanates from credit extended by non-bank institutions (such as retailers, non-bank vehicle financiers and developmental credit providers), while a significant portion consists of outstanding accounts. For instance, the national treasury reported that households owed municipalities R83.1 billion at the end of Q2 2017, up from R74 billion a year before.
Outlook for the third quarter of 2017
Preliminary estimates point to the real value of household net wealth recovering somewhat during Q3 2017. This is mainly as a result of the real value of financial assets increasing, whilst credit growth remained subdued. However, for households’ financial wellness to improve sustainably, they need to improve their decision making in terms of how much of their income they should use to save, spend, insure and repay debt – as this will to some degree offset the negative effects of political events on the economy.
Table 1: Estimated household balance sheet variables expressed as a percentage of their gross income
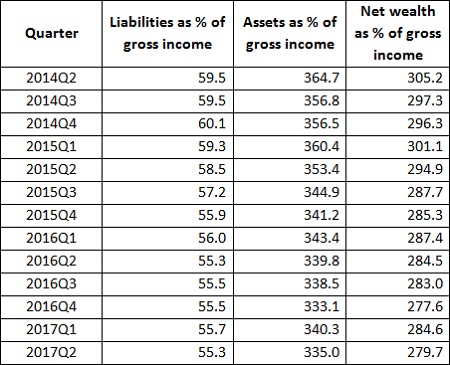
Sources: South African Reserve Bank Quarterly Bulletin September 2017; Own calculations.
