
Big long-term changes reflected, workers’ salaries cannot match inflation
The average South African salary grew just above the estimated rate of inflation, recording a 6.7% year-on-year growth, according to the latest BankservAfrica Disposable Salary (BDSI) data.
This level is lower than April 2016 where the disposable salary growth was 7.3%. BankservAfrica’s data shows that the average take-home salary in May was R13 142 which is slightly above April’s average of R12 877.
The higher monthly average trend is likely to continue due to the public sector wage increases. Although the BDSI median salary did not grow as rapidly, 50% of individuals with monthly take-home salaries paid into their bank accounts received at least R9 679 in May.
This typical take-home salary grew below inflation for the second time this year, reflecting that the lower inflation rate of 2015 is having an impact on the typical take-home pay as present inflation is far higher than the 4.6% average of last year.
The increase in the median take-home pay growth was the lowest since May last year, when the median also grew by 3.3%. Both these numbers are below the rate of inflation.
Graph 1: Nominal take home pay and bankable pensions
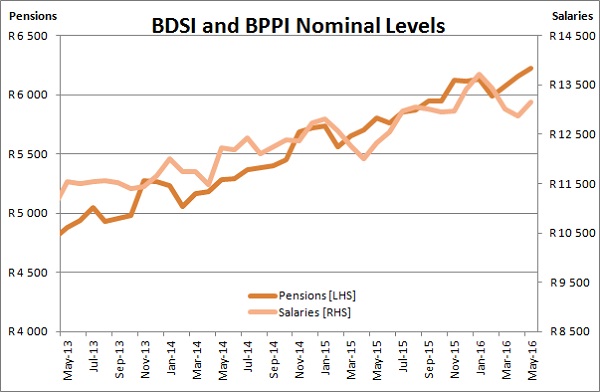
Source: BankservAfrica and Economist.co.za
Big long-term changes reflected, workers’ salaries cannot match inflation
BankservAfrica can reflect on four years of data this month, which shows some interesting trends. A longer view of take-home pay over the last four years adds to the debate on minimum salaries. While the salaries paid via the BankservAfrica payments system hold a greater bias towards high salaries, they tell a story of rapid change.
As can be seen in the graph to follow, the number of people receiving less than R4 000 per month in their disposable salary is now under 17%, down from around 21% four years ago.
Research shows that as many as one in eight South Africans has a garnishee order against them, which is likely to be more of the total.
This lowest take-home pay group saw a decline of nearly 13% over the same period, which indicates that people are moving out of this category.
The next group of salaries measured over a four year period are the category receiving between R4001 and R10 000 into their bank accounts. This group has declined from 43.3% of the total to just under 35% of the total. Previously, this was the biggest group, but now forms the second largest group of people. It has declined by 11.4% since May 2012.
Graph 2: The percentage of people in each broad take-home pay category
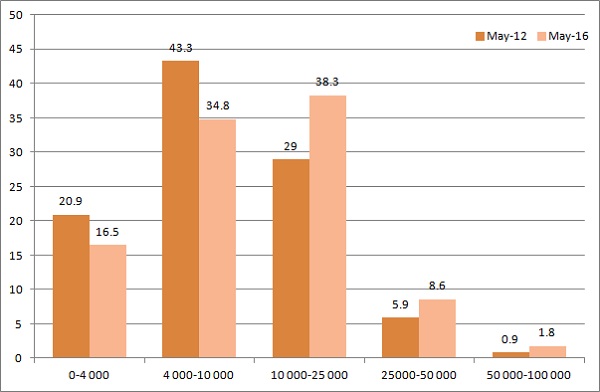
Source: BankservAfrica and Economist.co.za
The largest group of people get between R10 001 and R25 000 paid into their accounts, and make up 38.3% of this category that has also seen growth of over 45% in the four years to May 2016. The number of people moving up and into this category is astounding as the base was not small.
But it is the next two groups that have increased at the fastest pace by far. The number of people earning a disposable salary of over R25 000, but below R50 000, has increased by 60% compared to May 2012, when this category made up less than 6%.They now make up 8.6% of the total.
Those earning a disposable salary of between R50 001 and R100 000 more than doubled, growing with 104.9% over the last four years. While the base is small, they now make up just less than 2% of the total sample.
The final salaries category – which is not used in calculated averages or medians – is those who take home over R100 000, which grew by 218.4%.
Many of these payments are often retrenchment packages and once-off bonuses. Nonetheless, in 2013 this category was made up of 5 000 people and has increased to over 11 000 people now.
The statistics suggest that South African salary earners in the formal sector may be declining, but those that have kept their jobs have seen substantial increases.
The average take home pay increased by 24.3% over that period in spite of medical insurance and tax rates increasing far above that rate. The median take-home pay increased by 25.9%.
Inflation increased by 25.1% indicating that generally take-home pay increased more or less in line with inflation.
Increases in taxes took much of the higher pay cheques away as tax collections increased by 57.8%, with an estimated 48% average increase. Medical insurance went up by about 38%.
As these are two of the big three deductions that employees have before money is paid into their bank accounts, it is likely that both median and average gross salaries increased above the rate of inflation.
Take-home pay, however, just kept pace with official inflation over the last four years with consumers now feeling the pinch of higher taxes and medical insurance.
Table 1: Percentage change in the number of people per broad category
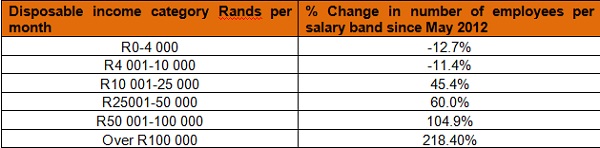
Source: BankservAfrica and Economist.co.za
Pension growth also slows but above salary growth
Banked pensions grew by 7.2%, the slowest year-on-year increase since January 2016. Pensioner accounts in May 2015 reflected a substantial increase, suggesting that once-off payments could have been made.
The average pension was R 6 226 for May 2016. It is interesting to note that the typical or median pension was R4 343 in the same month. This typical pension was up 12.5% and the best performer of all the main categories.
While pensions history cannot yet be tracked over four years, the evident trend is that the typical pension grew from just R3 088 in May 2013 to R4 343 a year later. It appears that pensions are increasing, albeit from a low base for retired people that receive a pension and not a government grant.
Table 2: The BDSI and BPPI data
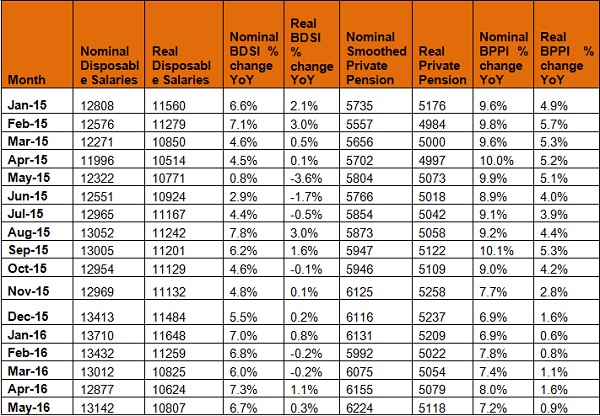
Source: BankservAfrica and Economist.co.za
