
Penny wise pound foolish
Recent years have seen an ever increasing emphasis on costs in the process of choosing investment management services and products, with special emphasis on the total expense ratio (TER) statistic gaining ground.
This price consciousness has even on occasion become a primary determinant in investment manager and product selection; a consumerist trend in marked contrast to that often seen in other professional services markets. After all, when deciding on a surgeon for an operation or a school for their children, people – when given the choice - seldom opt for the cheapest over the best.
The tail wagging the dog
This raises the suspicion that the tail might be starting to wag the dog a bit in the investment world, and an analysis of investment returns compared with TERs quickly confirms this.
When looking at all retail South African balanced portfolios - by far the most popular types of unit trust - over the past five calendar years, one finds an average calendar-year return dispersion of 27.4%, with top portfolios averaging almost 12% above the mean and bottom portfolios almost 15.5% below. These are the average differences between the best and worst performing portfolios and the mean return for all portfolios for each calendar year after the deduction all costs (all data from Morningstar).
A smaller gap
In contrast, the TERs available to make investment decisions on at the start of each year have an average dispersion of 4.1%, from 2.6% above the mean to 1.5% below.
Picking the right or wrong portfolio might gain 12% or lose 15.5%, which dominates the potential 1.5% TER savings or 2.6% extra expenses.
Surely though, lower-cost portfolios should on average perform better than their peers? This line of argument has after all fuelled the relentless growth of the exchange-traded fund industry globally.
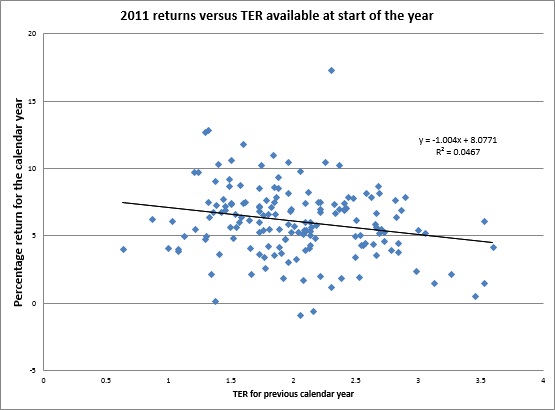
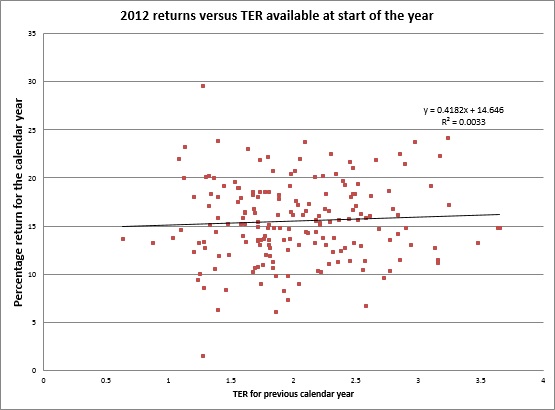
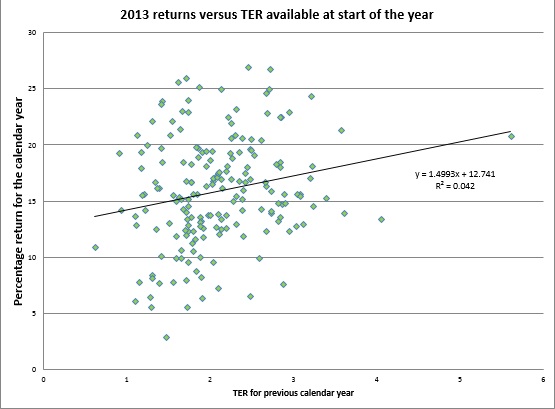
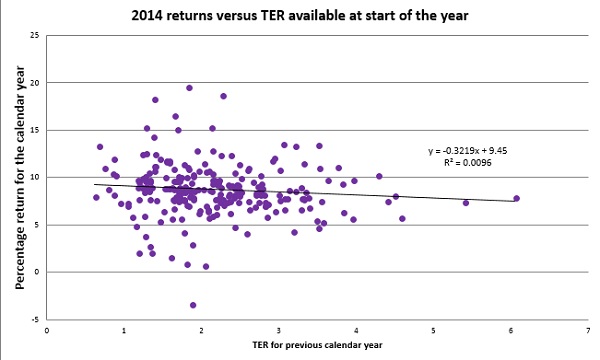
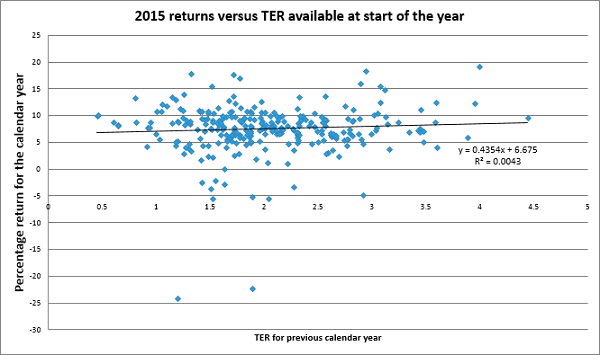
Once again though, analysing the data set paints a different picture: as the figures on the graph illustrate, when comparing calendar-year returns for all retail South African balanced unit trusts to the TERs available for decision making purposes at the start of the relevant year, and performing a regression analysis, there are no meaningful statistical relationships that emerge.
No insights
Thus, TERs offer no insights or predictive value when it comes to expected portfolio returns.
If anything, the fitted trends actually show higher TERs favouring slightly higher expected returns. Expressed in correlation terms, the relationships between TER and expected return are confused, inconsistent and very weak: negative 0.21 in 2011, 0.06 in 2012, 0.16 in 2013, negative 0.1 in 2014 and 0.07 in 2016.
Due to space constraints, the above is of necessity… not an exhaustive analysis. However, nevertheless, the conclusion is inescapable; without a doubt, selecting the correct portfolio is a far more important decision, with a vastly greater effect on investor wealth, than focusing on TERs, which statistically had little to no effect.
Portfolio selection, with the asset allocation, investment manager and strategy/style selection it entails, should resoundingly dominate the investment-decision-making process, as getting value for one’s money is much, much more important than the actual price paid.
