
Investment cycles and liquidity conditions
With the exception of three months, real all-share index returns measured on a year on year basis, have been positive since August 2009. Since reaching a bottom in February 2009, the JSE All Share Index (Alsi) total real return index has already advanced by 135% or 19% per annum, on average, over the past five years.
These are by any measures very solid returns. But how long will this still last? Many market watchers have been pointing out that valuations are rather high. The Alsi price-earnings (PE) ratio stood at 17,5 at the end of April, while the average PE ratio since 1995 had been around 14,5. This was indicating that current equity returns can only be sustained if earnings growth numbers improve significantly. And this is unlikely, although not impossible, given the rather subdued outlook for economic growth in the short to medium term.
Weighing up your chances
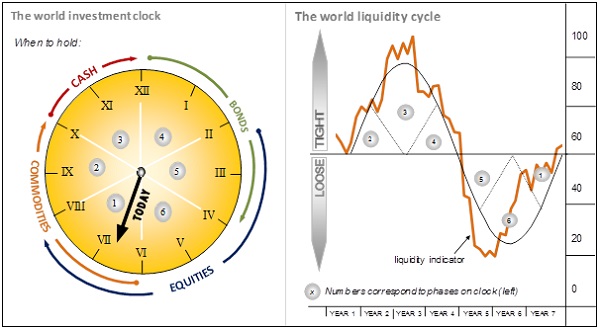
One useful measure to evaluate which asset classes stand to benefit given changing economic and financial conditions, is the so-called investment clock. A global liquidity index can be compiled from the weighted liquidity conditions in individual countries.
Normally, the data would include elements that measure whether central banks are easing or tightening and whether commercial banks are creating additional credit. In addition, a global liquidity index would also include some measurement of cross-border flows making use of banking, foreign direct investment and trade flow data.
Excess liquidity indicates that there is a surplus of liquidity in relation to the real economy’s needs, which can be invested in the financial markets. Ideally, a financial asset class should be bought when liquidity is abundant, and when most investors do not yet own it. Therefore, avoiding a market where investor sentiment is already very bullish and to rather wait for a cheaper market when overall liquidity is tight, can be seen as a good strategy.
Timing the cyclical nature of the markets
The liquidity cycle normally leads the business cycle by some nine to twelve months. Accordingly, phases three, four and five roughly coincide with an economic downswing, and phases six, one and two with an economic upswing.
It is probably fair to say that, based on what is happening with monetary policies in many economies, with the tone being set by the US, we are probably somewhere between six and seven o’clock on the world investment clock, the fourth phase of the liquidity cycle. This means that the time for equities, at least internationally, has not entirely passed and that commodity prices may be on the verge of a recovery.
A liquidity measure can also be applied to the South African situation. We are, in the words of the Reserve Bank Governor, now clearly in an upward phase of the interest rate cycle. It is generally considered that a tightening in monetary policy will slow demand in the economy as credit becomes more expensive.
Adjusting to new market conditions
Historical evidence of the movement of local liquidity conditions, and the equity market performance, show that equity investors have usually anticipated stricter financial conditions, which gave rise to weaker or negative equity market returns. Likewise, peaks in equity market returns either preceded or coincided with the bottoms of loose financial conditions.
With financial conditions showing tentative first signs of tightening, one could argue that equity returns will start to suffer. However, real short-term interest rates are still in negative territory while any future monetary tightening in this cycle is unlikely to be prolonged or very steep. The reason for this is mainly to be found in the fact that the economic growth outlook is remaining bleak.
It nevertheless appears unavoidable that equity returns should show some moderation. However, we may perhaps be spared a steep decline or prolonged bear market in equities this time around.
