
We know what an assumption does….

Albert Botha, fixed income fund manager at Ashburton Investments.
Looking at history, it is often the case that the biggest disasters come when what was believed to be true, turns out to be incorrect. When your underlying assumptions about how the work works is turned on its head.
“There is no way a storm could ever be that big.”
“These big banks could never default.”
“Interest rates can never be negative”
Our day to day lives are filled with assumptions about the behaviour of the world around us – many of them completely justified. We assume that day will follow night and that the sun will rise. We believe that our car will start in the morning. We stop at a red light, safe in the knowledge that others will as well…and yet we know that this is not always the case.
Cars don’t start 100% of the time – and when they don’t you are late for work or you miss an important meeting. Other drivers occasionally miss or disregard a traffic signal and the consequences can be tragic.
In much the same way, the investment environment functions under a set of assumptions. Deals are done with counterparties, believing that they will still be around in the future to make good. Investments are made with banks certain that they are safe, or that the government will bail them out. Every day we make decisions and act on what we believe to be the most appropriate set of assumptions, knowing fully well that they do not always hold – and every time the market runs headlong into its mistakes, it tries to learn and improve while the world becomes a little more complicated.
One of the primary underlying principles when it comes to the analysis of asset classes and modelling portfolios is that by studying the past we can gain insight into the future. And while this is true, it is based on the assumption the properties and composition of these asset classes remains relatively unchanged and that the relationship between then stays mostly constant.
This is, however, not always the case and South Africa has some egregious examples.
When modelling this risk, return and correlations of equities and bonds, we quite often forget that the equity market in no way represents a stationary or consistent equity factor. Below is a chart of how the composition of the Johannesburg Stock Exchange (JSE) has changed since June 2006. It breaks down the exposure into resources, industrials and financials.
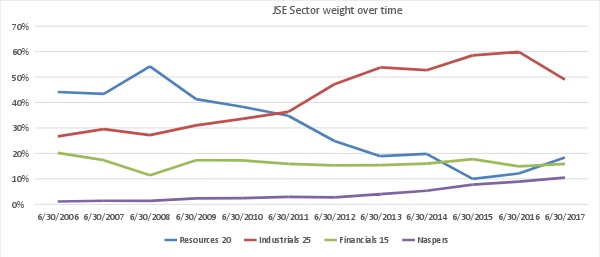
As you can see, the relative weighting in the index has been very volatile over this period. Resources rose from 44% in 2006 to 54% in 2008, followed by a tumble down to 10% in 2015. Industrials fluctuated between 26.7% and 59.9%. Naspers now accounts for a higher weight than the entire resources sector did in 2015. In other words, while the JSE is quoted as single index and is often seen to be a stable contributor of equity risk, the risks the investor takes and the factors that influence total performance has been very inconsistent.
An example of this is that resources had an annual volatility of over 30% for the last 3 years, while industrials averaged at only 15%. An index heavily composed of resources is more volatile than one with a lower allocation. Banks and other financial companies tend to be highly correlated to the local economy, while many industrials are rand hedges – the shifting weights in the index exposes the investor or portfolio to a variable factor that is inconsistent over time.
The problem comes when trying to use historical risk, performance and correlation numbers from an index that is constantly changing. Your historic analysis has little benefit when it no longer reflects your current exposure or the expected future. It may even give you a false degree of comfort as the performance correlation between asset classes has been rising over time. Thus using 10-year data will lead to an overestimation of the degree to which your asset allocation has diversified the portfolio.
The same is true when you look at the fixed income market. From 2004 to 2018, we have seen a steady increase in the duration of the All Bond Index (ALBI). It has increased by almost 70% from 4.4 to 7.4. What this means is that a 1% increase in yields would have resulted in a 4.4% capital loss in 2004 – now it results in a 7.4% capital loss. The volatility of the ALBI has increased accordingly, peaking at 12% per annum - just 2% shy of the 10-year average volatility of the JSE.
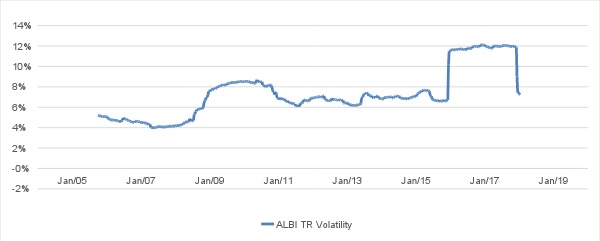
As a result of this, we have an asset class that has higher volatility and higher correlation than your long-term data would indicate, furthermore the longer duration of the ALBI means than the risk factors it is exposed to has shifted more towards fiscal concerns and away from interest rate risks and expectations. This results in a portfolio that carries more risk than you think with asset classes that no longer behave in ways that you would expect.
There are, however, potential solutions to these problems. In the equity space, we have in recent years seen the emergence of internal or custom indices that attempt to isolate a specific trait or factor and then track that over time. Some examples are value, momentum and low beta. These factors are benchmark agnostic and should be more consistent over time (the details of their construction will be in another article).
In the bond space, we fortunately have a potential solution already available. The ALBI is comprised of several sub-indices:
• 1-3 Years
• 3-7 Years
• 7-12 Years
• 12+ Years
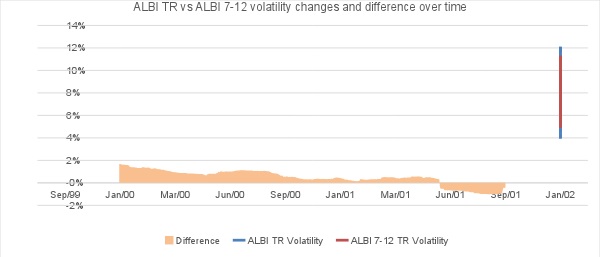
The first three of these can potentially be used in asset class and portfolio modelling as their characteristics have been more stable over time. Due to the increasing term and rate of issuance at the long end, we cannot use the 12+ index as readily. Below is a chart that shows how the characteristics of the 7-12-year index has changed over time and one can easily see that even though there has been variation, it has stayed within a band. This contrasts sharply with the visibly increasing trend in the ALBI.
Asset class and portfolio models are part science and part art. It takes experience to judge the relative merits of data inclusion, the applicability of optimisation goals and the effect of non-stationary data. In some discussions, the maxim that more data is always better has become one the primary assumptions underlying finance - yet increasingly it is becoming evident that care must be taken when data is selected for inclusion.
