
The Chinese paradox

Izak Odendaal, Investment Analyst at Old Mutual Wealth.
Chinese equities are up 27% year-to-date, and around 80% since June last year. The buoyancy of the Shanghai market has spilled over to Hong Kong. Naspers broke through R2 000 per share last week on the back of the increased market value of Hong Kong-listed Tencent, of which it owns a third. To many, the surging Chinese market resembles the period between January 2006 and October 2007 when the Shanghai Stock Exchange Composite Index rose fivefold in one of the more spectacular bubbles of recent times. The deflation of the bubble was equally dramatic, and the index lost 70% over the next 12 months. Even after the recent rally, the index is still 40% below its 2007 peak.
Slower growth a part of rebalancing
Meanwhile, Chinese growth slowed to 7% year-on-year in the first quarter, or 5.2% quarter-on-quarter annualised (the way we usually measure GDP growth in South Africa). This is the slowest growth rate since the global recession. The slowdown in Chinese growth was broad-based, with retail sales, industrial production and fixed investment growth rates all coming in below consensus estimates. House prices have been falling and other activity indicators in the housing market are also not encouraging.
China’s attempt to rebalance its economy away from investment to consumption will lead to slower growth. This implies faster consumption growth, but since investment is an unprecedented 48% of GDP, slower investment growth implies slower GDP growth. The trick for the authorities is to keep things stable as growth rates slow. A bicycle starts to wobble when it moves too slow (or too fast). There are some serious problems to be dealt with, but also signs that Beijing is committed to dealing with them. Recent examples are the national government absorbing local government debt, attempting to restructure inefficient state-owned companies and liberalising certain sectors of the economy. It is also easier to buy a second home. Over the weekend the Chinese central bank cut the reserve ratio requirement – the amount of reserves banks have to set aside to back loans - to stimulate bank lending. There will almost certainly be further interest rate cuts to ease the burden of the highly indebted corporate sector. With low consumer inflation (1.4%), and very negative producer inflation (-4.8%), real interest rates in China are very high.
Squaring the circle
How does one reconcile the boom in the stock market to the slowing economy? Firstly, as in the case of South Africa, the stock market does not represent the entire economy. Secondly, Chinese households have few useful places to invest their considerable savings. Bank deposits rates are regulated and barely beat inflation, the property market is tanking, and the government is cracking down on ‘trust’ products. The stock market is the last place to go. As the market rallies, it is inducing more and more retail investors to invest (surely reluctantly for many, given the scars of the 2007 bubble). Fourthly, the market might simply have priced in too much bad news. Therefore, the question is not whether the economy slows, but if it slows less than what investors thought it would. After all, the price: earnings (PE) ratio on Chinese equities was only 6x before the recent rally took off (according to Datastream). It was 30x at the peak of the 2006/07 bubble, when investors were pricing in double digit real economic growth rates. Finally, it might simply be a replay of 2006 /07, in which case it will end in tears. The explosion in turnover on the Shanghai index suggests it might be. However, the PE ratio is still only 9x, suggesting there is a long way to go before we can call this a bubble.
No good news for SA from the IMF
The Chinese GDP data was released in the same week as the International Monetary Fund’s (IMF’s) latest set of global forecasts. Chinese growth is expected to slow to 6.8% this year and 6.3% next year. Interestingly, India is now expected to grow faster than China for the first time. The IMF upgraded India’s growth outlook to 7.5% for the next two years.
Despite a weak first quarter, the IMF expects global growth of 3.5% this year and 3.8% next year in line with longer-term averages. The US is still expected to be in the lead in terms of developed economies, but the IMF has upgraded its 2015 and 2016 forecasts for the Eurozone, after several years of cutting them.
The IMF had bad news for South Africa. Electricity supply disruptions and tighter fiscal policy next year, led to real economic growth forecasts being cut to 2% and 2.1% for 2015 and 2016. The impact of slower Chinese growth on commodity prices and local mining has already been felt. The JSE All Share shrugged off the news, briefly breaking through 54 000 points for the first time.
Chart 1: Chinese and Hong Kong Equities
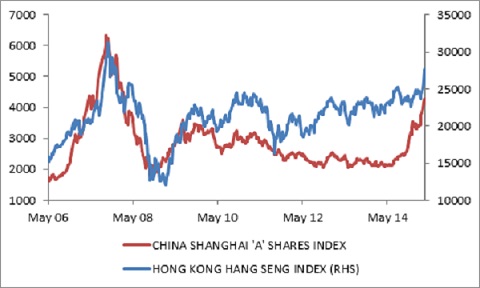
Source: Datastream
Retail sales picking up, but are valuations justified?
Real retail sales rose strongly by 4.2% year-on-year in February, up from 1.9% in January. Real month-on-month seasonally-adjusted sales increased to 1.9% from 0.2% in January. Overall nominal retail sales growth was 9.3% year-on-year up from 7% in January. Retailers are therefore benefiting from volume growth as well as turnover growth. Retail sales growth of around two to three percent in real terms and eight to nine percent in nominal terms appears broadly consistent with the economy’s underlying growth rate.
The categories with the largest weights in the retail sales index are general dealers (39%) and retailers of textiles, clothing and footwear (22%). The former grew by 4.8% year-on-year in February and the latter by 2%. All categories of retailers posted positive year-on-year growth, except retailers of household furniture, appliances and equipment with negative sales growth in real (-4.1%) and nominal terms (-4.4%), implying falling prices and volumes.
Implied retail inflation – the difference between real and nominal retail sales – slowed further to 4.9% in February, from 5% in January and 5.5% in December.
Consumer spending supported by lower inflation
Consumer spending in February would’ve benefited from the cumulative impact of petrol price cuts in the preceding months. The petrol price fell 28% from August to February. With lower inflation, growth in real wages of around 3% in 2015 is on the cards, which would make it the best year since 2011. The postponement of expected interest rate hikes should also support consumer confidence, with debt service ratios still at a historically low range. On the downside, the increase in personal tax rates and the double-digit electricity tariff hike will likely limit upside in consumer spending, while the rolling blackouts will probably limit job creation. The petrol price rose cumulatively by R2.70/l in March and April, eroding much of the gains of the global oil price collapse. There is also no sign of higher household credit growth.
Listed retailers have performed very well
The StatsSA retail sales data is an important input into overall gross domestic product growth, but is also useful to cross-check against the performance of local listed retailers with three provisos: StatsSA data also covers unlisted retailers (notable the struggling Edcon group, and smaller independent shops). The StatsSA categories do not map entirely to the JSE’s categories, and listed retailers have operations outside South Africa.
The JSE Food & Drug Retailers index (including Pick n Pay, Spar and Shoprite) has returned 11% year to date, outperforming the JSE All Share Index. The General Retailers Index (including Woolworths, Massmart and Truworths) has returned almost double that, namely 23%. Both indices have had a stellar month so far, reportedly due to renewed interest from foreign investors.
What about valuations?
The Food & Drug Retailers Index trades at a 12-month forward price earnings ratio of 19x. while the General Retailers trades at 18.4x. Both indices trade at a premium to the All Share Index (16.4x), but are in line with the ratings of retailers in other emerging markets. South African retailers are very profitable and well- run compared to EM peers.
The 2015 consensus earnings per share growth for the Food & Drug retailers is 14.2%, compared to the 7% nominal sales growth for the broadly comparable general dealers category in the StatsSA data over the three months ending February compared to the same period last year. The market is therefore pricing in a continued improvement in consumer spending. For JSE General Retailers, the 2015 consensus earnings per share forecast is 15.8%, while nominal growth in clothing and textiles sales was10.7% year-on-year for the three months ending February. Achieving 15% bottom-line growth off 10% top-line growth is not a huge stretch, but it does leave little margin for error. For instance, given the sizable import content of retailers, a weak rand is a significant risk.
Chart 2: South African retail sales growth
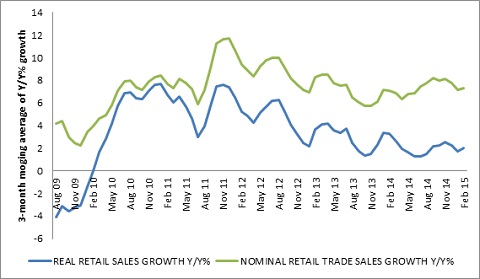
Source: StatsSA
