
Momentum Macro Bulletin – A gauge of the global macro temperature

Sanisha Packirisamy, Economist at MMI Holdings.

Herman van Papendorp, Head of Asset Allocation at Momentum.
Despite major central banks ramping up their balance sheets to unprecedented levels and running ultra-accommodative monetary policy rates in their respective economies, growth remains relatively weak worldwide while lacklustre inflation persists in many key regions.
Executive summary
Though central banks in the United States (US), United Kingdom, Eurozone and Japan have seen their balance sheets soar to 151% of GDP in 4Q15 from 49% in 4Q07 (see chart 1), policy efforts to spur on activity in struggling economies have been subject to diminishing marginal returns. More recently, the Bank of Japan (BoJ) and the European Central Bank (ECB) have joined Denmark, Switzerland and Sweden by ditching the more traditional policy easing measures and adopting a more unorthodox approach by cutting interest rates into negative territory in an effort to prevent the economy slipping into a recession and sliding back into deflation.
Chart 1: Central bank balance sheets as a share of GDP (%)
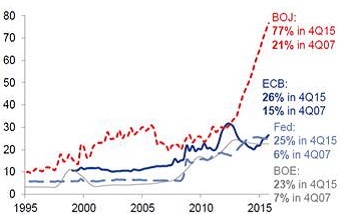
Source: Goldman Sachs
The aim of negative interest rate policies (NIRP) is to punish banks that hoard cash instead of extending loans to companies and households, thereby countering a subdued inflation outlook. The problem however is that rates below zero may not reduce borrowing rates in the real economy and may instead crimp banks’ profitability and encourage undue risk-taking in search of profits. The Bank of International Settlements (BIS) warned that it would be difficult to predict how individuals or financial institutions would behave if rates were to fall further below zero or remain in negative territory for an extended period.
In their January 2016 World Economic Outlook (WEO) update, the International Monetary Fund (IMF) raised concerns over a generalised slowdown in emerging market (EM) economies while a modest, yet uneven, recovery was seen as remaining underway in advanced countries. While still anticipating a pick up in global growth activity, the IMF noted that the pace of acceleration was expected to be slower than initially projected in their October WEO on the back of China rebalancing its commodity-intensive growth model (away from infrastructure and exports and towards consumption), a lower commodity price outlook and a gradual tightening in monetary policy in the US.
The IMF pitched real GDP global growth estimates at 3.4% for 2016 in the January update, but this is likely to be revised lower again. The latest Bloomberg consensus estimates for March place real GDP growth prospects at only 3.0% this year from 3.3% in January 2016. While the likely slowdown in emerging markets was addressed by the IMF, economic surprises in this region have still been to the downside. Moreover, developed market (DM) growth prospects have dimmed somewhat too on the back of disappointing activity. The Citigroup Economic Surprise Index for G10 economies (a proxy for developed markets) deteriorated by nearly 15 points since the start of the year, although the index has partly recovered from its mid-February low.
Global economic developments
The momentum in economic surprises has been largely negative since the start of the year (see chart 2). The Organisation for Economic Co-operation and Development (OECD) points to weak trade and investment and low commodity prices as the key drivers behind the deterioration in economic growth surprises, while disappointing demand conditions and poor wage growth have further driven global growth prospects weaker despite the boost from low oil prices and interest rates.
The deterioration in developed market growth surprises was led by softer than anticipated economic activity in Japan and the Eurozone, while data surprises turned positive in the United Kingdom (UK) more recently and bottomed out in mid-February in the US. Meanwhile less buoyant activity in Asia Pacific (most likely as a result of weaker trade conditions) and the so-called BRIC nations (Brazil, Russia, India and China) led economic surprises weaker in the emerging market (EM) composite, while economic growth activity surprised to upside in Latin America (LatAm) and Central and Eastern Europe, Middle East and Africa (CEEMEA).
Chart 2: DM and EM growth surprises in negative territory
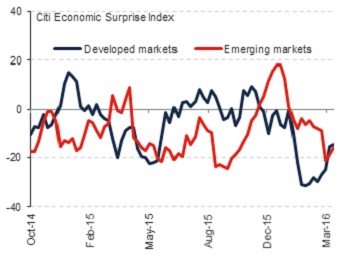
Source: Bloomberg, Momentum Investments
In both cases, the Bloomberg consensus GDP growth forecast for developed and emerging regions in 2016 has migrated to levels below that experienced in 2015. The consensus growth forecast for DM decreased materially from 2.4% in May 2015 to 1.9% in March 2016, lower than the 2.0% GDP growth figure reported for 2015 as a whole. The IMF, World Bank and OECD, however, still expect global real GDP to increase at or above 2015 levels.
These international bodies have all reiterated the importance of maintaining an accommodative monetary policy stance within DM while bolstering fiscal policy efforts to support the economic recovery. In order to boost longer-term growth prospects in DM, the IMF recommends strengthening labour market participation, tackling the large debt overhang and reducing the barriers to entry in product and service markets.
Consensus forecasts across the EM composite for 2016 have dropped from 5.1% in May 2015 to 4.3% in March 2016, undershooting the reported 4.4% growth rate in 2015, whereas the IMF and World Bank continue to see an improvement in growth materialising in the EM region this year. The IMF observed that the challenges facing net commodity-importing EMs vary from those confronting net-commodity-exporting EMs. Inflation pressures have reduced in net importers of commodities allowing easier monetary policy to fix ailing demand in regions such as Emerging Asia. Meanwhile, fiscal and current account deficits have been hit hard in net commodity-exporting nations. LatAm faces the most severe budgetary pressures. Debt ratios here are soaring on the back of the commodity-inspired slump. Such countries will have to stabilise public finances before fiscal pressures prompt negative sovereign ratings action.
With advanced economies set to expand at a slower than initially anticipated pace, emerging markets could benefit by DM interest rates remaining lower for longer provided that the developed region does not slip back into a recession. Recessionary conditions across DM would be bad news for EM growth as well given the trade linkages between the two regions. With the upward momentum in the US dollar fading (as investors have shifted out their opinion on when the US Federal Reserve (Fed) will be able to resume their interest rate normalisation cycle), dollar-denominated commodities and EM currencies have benefited. Nevertheless, the Institute of International Finance reported that bank lending conditions in EMs tightened further over 4Q15 implying that tighter financial conditions are likely to endure, challenging growth across the EM composite.
Eurozone
A mild economic recovery remains underway in the Eurozone thanks to ultra-accommodative monetary policy, a low oil price and currency depreciation. Relative to 4Q14, GDP prints have improved across the board for a number of key countries in the region (see chart 3), but the pace of growth has been relatively slow leaving the output gap for the euro area at an estimated negative gap of 2.1% in 2015 based on IMF figures. According to the IMF, the gap between actual and potential growth will likely remain negative even into 2020. Although the US economy is 10% larger in real GDP terms today relative to the pre-crisis peak in early 2008, the size of the Eurozone economy in real terms is more or less unchanged over the corresponding period.
Chart 3: Real GDP growth (% y/y) has improved across key countries in the Eurozone
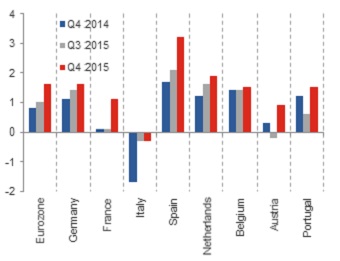
Source: Bloomberg, Momentum Investments
Despite an improvement in growth to date, Eurozone growth prospects for the year have dimmed from 1.7% in May 2015 to 1.5% in March 2016 as reflected by the Bloomberg consensus forecasts. Previous sources of GDP support, including an improvement in the labour market and euro weakness appear be fading. Moreover, one would need a further substantial drop in oil prices to benefit consumption growth by the same magnitude as last year given the low oil price base created over the course of 2015. Consumers are nonetheless expected to sustain the modest GDP recovery as household budgets stretch on low oil prices. Fixed investment has lagged the recoveries of previous GDP upturns on the back of stuttering growth in credit extended to corporates and economic prospects remaining mild at best. Meanwhile, the region’s export prospects remain vulnerable to further setbacks in emerging economies.
On a regional basis, momentum appears to be slipping in Germany while consumer confidence has waned in France and Italy. German firms are as concerned about economic prospects today as they were in late 2012, with only a small percentage (net 4%) of investors expecting a recovery in the latest German ZEW Investor Sentiment Index.
Growth concerns and a paltry -0.2% print on headline inflation in February led the European Central Bank (ECB) to give the economy yet another dose of stimulus. Ultra-cheap long-term funding was increased from its monthly run rate of €60 billion to €80 billion (to be carried out until March 2017) and extended their purchases to corporate debt while the main refinancing rate was cut to 0% from 0.05%. The Bank also cut its deposit rate from 10 basis points to -0.4% and lowered the marginal lending rate (used by commercial banks to borrow from the ECB) to 0.25% from 0.3%. While this latest set of policy actions exceeded market expectations, ECB President Mario Draghi’s signal to an end in rate cuts disappointed the market. Investors had further hoped for a tiered deposit rate system (already used in Switzerland and Japan) to limit the direct cost to banks while encouraging lending to companies.
The ECB acknowledges that while the recovery in the euro area is expected to continue, momentum has slowed on the back of softening global activity particularly in emerging markets. The Bank expects real GDP growth of 1.4% in 2016, increasing to 1.8% (relative to the consensus estimate of 1.6%) by 2018. Should GDP growth continue to undershoot expectations in a low oil price environment, inflation will continue to remain very weak putting pressure on the ECB to maintain strong policy support. The ECB expects headline inflation at a mere 0.1% this year, increasing to 1.6% by 2018 (in line with the ECB survey of professional forecasters), but remaining below the ECB’s target of 2%.
The recent wave of asylum seekers into the euro area could potentially boost near-term GDP growth through increased fiscal spend, but threatens the longer-term growth outlook for the region. The number of people seeking asylum in the European Union in 2015 reached over 1.2 million (80% originating from Syria, Iraq and Afghanistan) which was more than double that of the previous year. Policies to better integrate immigrants has taken on a heightened urgency as not all countries are participating as they should. Germany has been critical of other EU countries’ (namely France and the UK) poor attempts to share the burden of the influx of immigrants. The burden has increased on Italy and Greece and efforts to relieve this have had little success given that select states in Central and Eastern Europe have refused to share the refugee burden.
United States
Though the Bloomberg consensus forecast continues to pitch real GDP growth this year at 2.1% (above our own internal view of trend growth at 2%), the market expectation has deteriorated markedly from 2.8% in May 2015 to 2.1%. We expect an improving labour market to support household consumption expenditure while low mortgage rates, tight home supplies and pent-up demand are likely to drive a further improvement in the US housing market this year.
The average run-rate in US non-farm payrolls over the past twelve-month period remains robust at 223 000 and has picked up to 235 000 over the past six months. After reaching its lowest level since 1977 in September last year, the US labour force participation rate improved marginally inching higher from 62.4% to 62.9% in February, indicating that a larger number of US citizens are trying to get back into the job market. That said, the structural decline in the US labour force participation rate is largely the result of demographic shifts (the so-called wave of baby-boomer retirements), implying that an ageing US population will be a natural drag on the participation rate. Nevertheless, the ratio of employed to unemployed persons recovered to levels last seen prior to the global financial crisis.
There are also 2.2 million people who had been unemployed for six months or longer, but that is significantly lower from the highs of the recession (although still well above the pre-recession mark of c.1.2 million people).The number of discouraged work seekers (those who have given up looking for a job for a period longer than four weeks) has also shown signs of improvement, decreasing from its peak of 1.3 million in 2010 to 599 000 more recently. Though the current level is still higher than the 378 000 long-term average, survey results indicate that US employers are finding it more difficult to find workers as evidenced by Deutsche Bank research which suggests that it currently takes 27 days to fill a vacant post, up from 23 days in 2006.
A further tightening in the labour market has been less successful in stirring up higher wage inflation at the same pace that has been the case historically. However, wage growth is slowing ticking higher. Average hourly earnings for private industries are growing at close to 2.3% in year-on-year terms while the percentage of firms planning on raising wages has trended higher from a low of 3% to 19% in the latest survey results for February.
In addition to healthy jobs growth, elevated savings, positive real wages (partly owing to low oil prices) and new highs being reached on US household wealth metrics will likely continue to support further growth in household consumption expenditure, which increased close to 3% in real terms in the final quarter of 2015.
Services momentum, which has lifted US growth to above 2% on average for the past six years, has slowed in the US with the ISM non-manufacturing index dipping from its recent peak of 59.6 in August 2015 to 53.4 points in March (see chart 4). Nevertheless, the index remains in expansionary territory. The bulk of the jobs that have been created over the past year have also originated in the private services-related sectors of the economy in line with firmer growth, while the government, utilities sector, mining and transportation sectors have suffered net job losses over the past twelve months. Softer growth momentum has raised a more cautious approach to near-term monetary policy, but a more promising outlook on inflation suggests that two more interest rate increases (of 25 basis points each) by the Fed this year cannot be ruled out.
Chart 4: Services momentum slowing, but still positive
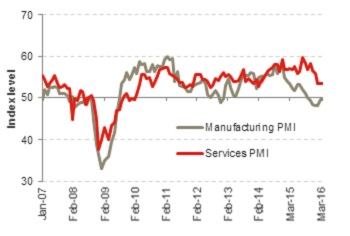
Source: Bloomberg, Momentum Investments
US inflation is trending higher on a range of measures including core (headline excluding food and fuel) and the trimmed mean (outliers removed). Core PCE (consumption deflator) related to both goods and services has turned higher. Core goods inflation is approaching 0%, after having trended in negative territory since late 2012. Meanwhile core services inflation has remained more stable over the corresponding period, increasing at close to 2% on average. Indications of higher wage expectations by consumers and higher wages to be awarded by employers in the small business survey will likely further drive inflation measures higher over the course of the year.
Politics is expected to take centre stage as we approach the US presidential election in November this year. Overall spending could end up marginally higher, boosting overall GDP. A Republican win would likely result in less tax reform and lower tax rates (potentially including lower costs associated with repatriated foreign earnings), with an increase in defence spending funded through expenditure cuts elsewhere or a lift to government spending in aggregate. A Democratic victory will most likely result in higher spending on infrastructure and increased benefits for low and middle-income earners. In our opinion, the outcome of the presidential election is unlikely to sway the Federal Reserve on their near-term monetary policy views.
United Kingdom
Britain faces a key decision on the 23rd of June of whether or not to remain in the European Union (EU). With current polls suggesting only a marginal win for the “stay” camp, the risk of a so-called Brexit (British exit) remains high. The YouGov referendum tracker polled in early March points to 40% of the votes favouring remaining in the EU, 37% voting to leave (with the rest split between no vote and uncertain).
The rise of the UK Independence Party (Ukip) and a failure to control the migrant crisis has further fuelled the Eurosceptic movement. In our opinion, a Brexit would be negative for both the UK and EU. The EU accounts for up to 45-50% of British exports, while Britain accounts for roughly a tenth of the EU’s. YouGov surveys reveal that the perceived substantiality of the deal makes a difference to how people say they will vote. Less than a fifth of those surveyed see the economy being worse off economically in the event the UK left the EU with 23% expecting a faster rise in prices. Half of the respondents expect there to be less immigration should a Brexit materialise, while 18% believe it will be good for jobs. These results imply that immigration and employment opportunities rank high on the agenda for the “leave” camp.
In the event of a Brexit, we would expect a reasonably large drag on investment, a sharp increase in financial market volatility and a likely increase in political tensions. Household consumption expenditure would likely weaken on higher inflation and negative employment effects. A reduction in capital inflows and slow labour force growth would reduce potential growth in the long run, while the region would have less favourable trading relations with the EU. The reaction function of the Bank of England (BoE) would also likely be different under a Brexit scenario. Although policy could stay on hold initially, a weaker currency and higher inflation would prompt a faster pace of rate hikes. With exit negotiations likely to be drawn out under a Brexit scenario, an actual exit could be extended to early 2019 resulting in protracted economic uncertainty.
Chart 5: Trade-weighted sterling has weakened as economic uncertainty has arisen
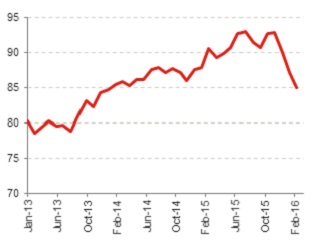
Source: Bloomberg, Momentum Investments
According to a survey by Barclay’s, 93% of 765 global investors have not materially changed their allocations in light of the referendum. The survey suggested that only 25% of investors see Brexit as an event risk that would lead to persistent sterling weakness with 30% of investors having hedged or made marginal adjustments. The 18.4% strengthening in the sterling on a trade-weighted basis between March 2013 and November 2015 has been partially unwound (8.5%), since, on the back of increased uncertainty (see chart 5). The weaker trade-weighted sterling, which could persist into the vote, is likely to lend support to exports and overall GDP growth in the near term.
Emerging markets
EM growth forecasts have been down pulled down further to the extent that the market now sees the expansion in real GDP this year slowing from the pace observed over 2015. The gap between the composite PMI readings of developed versus emerging markets has narrowed mostly owing to a deterioration in DM prospects rather than a reacceleration in EM (see chart 6). However, the stability in the Chinese currency, relatively stable oil prices and supportive developed market central bank policy will provide some support for growth in the region this year.
Risk appetite in this asset class has improved markedly following the Fed’s communication that fewer rate hikes and a more protracted interest rate cycle was likely to take place given growth and financial market stability concerns. Moreover, oil prices look set to drift marginally higher into next year. The US Energy Information Administration estimates an oil surplus extending into 2017 (1.6 million b/d in 2016, declining to 0.6 million b/d in 2017). Although there has been a further decline in shale production in the US, Iranian oil has come back online, preventing a steeper rise in the oil price.
Increased risk appetite is evident in the VIX volatility index retracing to 14.7 points in late March from levels above 40 points in August last year when broader emerging market fears spiked. The JPMorgan EMBI spread has likewise narrowed from 537 points in mid-February to 437 points in late March.
Dispersion across emerging market countries persists. The commodity-exporting bloc is likely to continue facing stagflationary pressures as currency weakness keeps inflation elevated, while countries within Emerging Asia and Eastern Europe are likely to ease policy rates further on low inflation pressures thanks to subdued oil prices. Net commodity exporters are also facing increasing budgetary constraints leading to lower credit worthiness scores. According to JPMorgan, 18 of the 63 sovereign ratings changes (between January 2015 and February 2016) conducted by Fitch, S&P and Moodys have been negative with a large proportion of the ratings action being targeted at EMs. The key reasons underlying these negative ratings actions include a low growth trajectory with no implementation of a growth plan, vulnerability to commodity prices and low policy predictability.
Chart 6: EM PMI remains in unfavourable territory
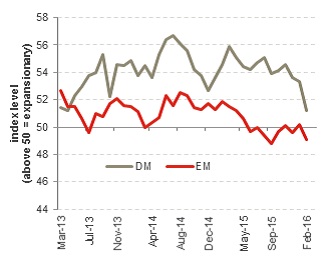
Source: IMF, Momentum Investments
To a large extent, EM underperformance can be attributed to China’s plan to eliminate overcapacity in its traditional industrial and export sectors as it transitions to a more services-related economy (targeting a 56% share of GDP by 2020) while focusing on higher-value, technological products. The Chinese authority’s 13th five-year growth plan (developed by the National People’s Congress to discuss plans for the country’s development over the next five years) expects the region to grow at an average of 6.5% between 2016 and 2020. This would still leave the level of real GDP per capita at double the 2010 level by 2020 further promoting social development. The plan aims to shrink China’s bloated steel and coal industries, reduce government’s role in business and better enable operating conditions for setting up new businesses. We expect slow and steady growth in the household consumption and services sectors of the economy, while heavy industry zones are likely to remain depressed with a limited spillover to the rest of the economy. China is currently running its largest trade surplus in history while their share of global exports ramped up to 15% of total global exports in 2015 from 4% in 2000. A lower exchange rate will likely benefit firmer Chinese exports going forward. We expect targeted stimulus to continue to maintain growth rates in line with the country’s five-year plan including further fiscal stimulus, lower interest rates to encourage households to borrow more and lower reserve requirement ratios to buoy the property market.
In the rest of the BRIC (Brazil, Russia, India and China) nations, India remains the bright spot. Lower oil prices have helped the current account deficit to narrow from 4.8% of GDP in 2012 to 1.4% in the final quarter of 2015, while fiscal authorities have maintained their commitment to stick to existing fiscal targets, building their deficit projections on credible revenue assumptions.
Meanwhile, conditions remain bleak in Brazil, where a lack of a fiscal anchor and heightened political scandals have led to all three ratings agencies downgrading Brazil to below investment grade and maintaining a negative outlook on the sovereign. After contracting at 3.7% last year, the market has downgraded their estimate of real GDP growth for Russia from 0.5% to -1.5% in 2016. Russia will likely continue facing growth headwinds in the form of subdued oil prices while inflation could remain elevated at above 8.5% this year after posting an elevated 15.6% print in 2015.
South Africa
China’s phenomenal growth rate, averaging 10.8% between 2000 and 2007, funded excessive consumption in South Africa (SA) over the same time period against a favourable backdrop of rising global growth, improving investor risk appetite and abundant cheap capital originating from stimulus packages in developed countries (with the post-crisis stimulus programme led by the Fed and later joined by the BoE, the ECB, the Bank of Japan and others) which poured into emerging countries.
The commodity cycle has however turned as China attempts to shift its growth reliance away from commodity-intensive avenues of growth including industrial and low value-add manufactured export activity towards high-quality, technological exports, consumption and services. The Bloomberg commodity price index (which does not overweight oil given the restriction that no commodity together with its derivative may constitute more than 25% of the index) slid by 55% from its 2Q11 peak to recent levels, leading to a 10.3% decline in SA’s terms-of-trade (export prices relative to import prices).
Real GDP per capita (in US dollar terms) followed the upward direction of SA’s terms of trade during the commodity boom up to 2011 and has since tapered off, hinting at a non-trivial relationship between GDP per capita performance in SA and natural resource rents. GDP per capita levels started to retrace in 2011 when the commodity outlook worsened. With commodity prices likely to remain subdued well into 2017 on the back of an oversupply in global stocks and modest demand, the outlook for consumption spend in SA remains muted for at least the next two years.
Chart 7: Average living standards have declined since 2011
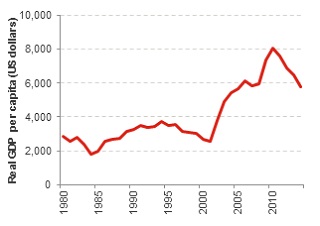
Source: IMF, Momentum Investments, data up to 2015
SA’s failure to capitalise on the proceeds of the commodity boom has led to growth occurring predominantly in the non-tradeable goods sectors of the economy which has further exacerbated the unemployment crisis given a slowdown in labour-intensive growth sectors. Manufactured exports as a share of total exports has fallen from over 60% in 2002 to 45% in 2014 while the share of ore and metal exports increased from c.13% to over 30% over the corresponding period. The steady decline in SA’s non-mineral tradable sector has led to a decrease in demand for relatively unskilled workers as the shrinking industry has become increasingly mechanised. As a result, SA’s export of tradable goods has become relatively cost uncompetitive. As global risk appetite has waned, emerging market currencies have come under pressure, but a high cost base and a number of structural rigidities have prevented SA’s exporting firms from responding further to the exchange rate depreciation post the crisis.
In a recent paper, the IMF cited major internal rigidities and external downside risks to the outlook for growth in SA. Electricity shortages, labour market uncertainties and an associated skills deficit have held growth back in the region. Broader policy uncertainties, domestically, including a lack of clarity around minerals legislation and black economic empowerment (BEE) requirements have further hindered real growth. Externally, the IMF notes that global secular economic stagnation and financial market volatility threaten the outlook for a more meaningful improvement in growth.
In response to the leading, co-incident and lagging indicators turning south in year-on-year terms, the South African Reserve Bank (SARB) announced that the economy had officially entered a downturn (when aggregate economic activity either contracted or increased at a slower rate than its long-term growth trend) in November 2013, ending an upward phase of the business cycle that lasted for (a longer than average) 51 months. The downturn has no doubt been exacerbated by the worst drought in decades which is expected shave off between 0.3% and 0.5% from overall GDP growth. According to Standard Bank however, there is only a 10% chance that El Nino weather conditions will persist into the agricultural season over 2016/17, while there is a 90% chance of normal or above normal (La Nina) rainfall.
Nevertheless the drought has already begun to have a negative impact on domestic food prices (maize, fruit and vegetable prices in particular), pushing overall inflation forecasts higher for the year. Despite recent strengthening in emerging market currencies (following a more dovish rhetoric by the Fed), the JPMorgan emerging market currency index is still markedly weaker than where it traded a year ago. Unpopular political decisions in December last year have further damaged business confidence, domestically, keeping the rand elevated and posing a key threat to the inflation trajectory. Inflation is likely to average around 6.5% this year and next, breaching the upper 6% target for five consecutive quarters, with wage pressures and rand risks posing risks to the upside.
The SARB is likely to react to slowing growth and a rising inflationary trajectory by hiking interest rates by a further two rounds of 25 basis points each, taking the repo rate to 7.5% over the next twelve months in an effort to contain inflation expectations which remain stubbornly above the target band for businesses and trade unions (i.e. the price setters of the economy), even on a five-year forward-looking basis. In reference to the real interest rate, the SARB has noted that monetary policy remains highly accommodative and as such we are looking for real rates to recover close to an average of 1% over the next two years. In the absence of substantial foreign direct investment into SA, SA’s still-sizeable current account deficit will remain heavily reliant on higher real interest rates to attract foreign portfolio flows in a potential risk off environment where commodity prices are likely to remain under pressure, limiting gains on SA’s terms-of-trade.
Against the backdrop of a low growth trajectory (with little progress on the country’s economic development plan), low policy predictability and continued vulnerability to commodity prices, SA remains at risk of losing its investment grade rating by year end. S&P rating agency currently has SA’s foreign debt rating on the lowest investment rung and has placed South Africa on a negative outlook. Of the metrics that SA is scored against, we are most at risk of losing ground on the economic assessment score. S&P downgraded the economic assessment metric from “neutral” to “weakness” between June and December 2015. A low growth environment will likely restrict SA’s ability to raise taxes or cut expenditure leaving fiscal authorities with little wiggle room. According to SBG Securities, S&P’s key measure of economic growth is the real GDP per capita measure. In SA’s case, real GDP per capita has migrated steadily lower since 2011 while population growth has increased to 1.6%. S&P’s optimistic real GDP forecasts of 1.6% in 2016, 2.1% in 2017 and 2.5% in 2018 could see SA getting back within the neutral range for their measure of ten-year average real per capita GDP growth. However, if these are revised down closer to the Bloomberg consensus of 0.7% in 2016, 1.4% in 2017 and 2.0% in 2018, SA will falter on this metric which could trigger a downgrade by the end of the year.
Subdued growth prospects limit the ability of SA’s fiscal authorities to respond to economic shocks. Though S&P rates SA’s debt burden as “neutral”, the size of our government interest bill relative to government revenues has increased to a worrisome 13%. Risks from contingent liabilities, currently accounting for 14% of GDP (10% when stripping out the state-owned enterprises with stronger balance sheets) further reduces SA’s fiscal flexibility. Although S&P still scores SA as neutral on the institutional and governance effectiveness score (measuring the resilience of the economy, the strength and stability of civil institutions and the effectiveness of policy-making), a highly polarised political landscape makes future policy responses difficult to predict and jeopardises the momentum of structural reform in the country. Areas such as labour market reforms (including the prevention of prolonged and violent strikes and implementing a secret strike ballot to prevent worker intimidation), BEE and mining policies need to be addressed urgently to promote structural growth in the economy for SA to earn its spot amongst its investment-grade rated peers. Without sufficient momentum on the structural reform agenda to benefit longer-term growth, SA is facing the prospect of junk status by at least one of the main rating agencies (S&P) by year end.
