
Domestically focused sectors offer reasonable value on JSE

Izak Odendaal, Old Mutual Multi-Managers
The JSE All Share Index remains trapped within its two-year trading range of between 46 000 and 55 000 points, meaning that dividends and stock picking generated most of the returns for local investors. In US dollar terms, the index is 20% lower than two years ago. Why then the eye-wateringly high price to earnings (PE) ratio of 23? The PE ratio is pushed up by large global companies, whose fortunes are not linked to the local economy (Naspers, SABMiller and British American Tobacco), while the share prices of mining firms have rallied even though these companies have not yet reported earnings growth.
Offering value
There are sectors on the JSE that are still trading at relatively attractive valuations, especially those focused on the local economy. The overall All Share Index no longer reflects the South African economy, with only 45% of revenue generated inside our borders. This trend is likely to continue, with recent figures from the South African Reserve Bank (SARB) showing that South African firms spent R80 billion on acquisitions abroad in the four quarters to end June, while private investment in the domestic economy declined by 5% in real terms over the same period. South Africa is unlikely to see a strong recovery without increased local private investment. However, with local businesses and individuals growing their offshore assets while foreign-currency denominated debt levels remain low, the economy now has a reasonable built-in hedge against currency weakness.
Some of the areas on the JSE that appear to offer value are banks and some retailers, with both sensitive to interest rate changes. However, the retail index itself is split between food and drug retailers (including Pick n Pay, Shoprite and Massmart) that trade at relatively high PEs above 20, and general retailers (mostly the clothing retailers) that are much cheaper with forward PEs in the mid-teens. General retailers and banks have lagged the JSE over the past year.
Retail growth slows
What are conditions on the ground like for retailers? StatsSA data from last week show that real retail sales growth has slowed substantially. The year-on-year growth number of 0.8% in July was half of June’s growth rate, which in turn was half of May’s. This is largely due to higher inflation, as nominal retail sales growth has not slowed down by nearly as much, hovering around 7% to 8% for most of the year. This is similar to the reported average domestic sales growth for the large retail groups. For economists, the real (inflation-adjusted) numbers tend to be more useful but analysts of company financial statements care about nominal sales and profit numbers.
Nevertheless, household spending is under pressure. The worst hit category was ‘other retailers’, which includes e-commerce, jewellers, bookstores and sporting goods stores, with an 8.5% year-on-year real decline. Beleaguered retailers of furniture and appliances also posted an 8% annual decline in inflation-adjusted sales, with consumers postponing or cancelling purchases of durable goods. Tighter lending criteria imposed by regulations probably also played a role. The biggest category of retail sales, general dealers (like Pick n Pay) posted real growth of 1.2%.
The slowdown in spending is not all that surprising; given the pressure building on household finances. Inflation, particularly food inflation, has been creeping up. The SARB hiked the repo rate from 5% to 7%, which in turn raised the prime rate from 8.5% to 10.5%, while more risk-averse banks widened the spread at which they lent over prime. Household borrowing, including mortgages, has been growing slower than incomes, providing little support for spending.
According to the SARB, the ratio of household debt to disposable income fell to 75.1% in the second quarter. This ratio peaked at 85.7% in 2008, at the height of the consumer borrowing boom, having been only 54% in 2000. It is worth noting that most of this debt is comprised of mortgages, meaning that there is an asset linked to the liability. The ratio of households’ net wealth to disposable income was 385% in the second quarter, although this wealth is highly concentrated in a small portion of the population.
The more relevant debt metric shows what portion of income is spent making interest payments. The ratio of debt service costs to disposable income has been rising steadily since 2013, as interest rates have risen for most borrowers. In the second quarter, this ratio was 9.8%, a percentage point higher than in 2013. But it has been a very mild interest rate cycle compared to our history, and because debt levels have declined, the debt service ratio did not increase by nearly as much as in the previous cycle, when it rose from 6.4% in 2004 to 13.8% in 2008, eventually squeezing consumers’ purchasing power.
With inflation expected to decline into next year, interest rates are probably in peak territory, while wage increases remain sticky around 8% annually. Typically, wage increases are linked to historic inflation, so if inflation declines there is a boost to real income. The burden of servicing debt should therefore stabilise. The SARB is expected to keep the repo rate unchanged this week.
The exchange rate is also significant for retailers; not only because a stronger rand supports consumer sentiment by placing downward pressure on inflation and interest rates but also because it reduces input costs, thus boosting margins.
Bank results have been good
The large local banks offer an attractive dividend yield, and a forward PE of 10, below the 10-year average. The big four banks posted better-than-expected results for the period to June (either half year or full year). The area to watch in future is non-performing loans, which tend to rise with a lag as the economy slows down (and spikes if there is a recession). Banks make provision for bad loans by setting aside capital, which reduces profitability. The banks’ provisioning for bad loans remains quite conservative, meaning that if things might not turn out as bad as they are provisioning for, earnings could surprise positively. An analysis by PwC found that bad debts increased to R17.2 billion, making a dent in otherwise strong results.
With lending growth muted, especially to households, the risk of a large build-up of bad debt is probably limited. However, the constrained lending activity does mean that there is a lot of emphasis on cost control given, including borrowing costs (banks fund their lending activities by a combination of deposit taking, issuing shares and borrowing in the money and bond markets). According to the PwC study, the big four banks have also assumed that the South African government will be downgraded later this year, which would impact their own ratings more or less automatically, potentially increasing funding costs.
Ratings depend on growth
Moody’s said last week that it was concerned over political infighting and the uncertainty over leadership at the National Treasury. It could downgrade South Africa’s rating unless economic growth improved and there were reforms at loss-making state-owned enterprises. The agency has South Africa two notches above sub-investment status, while Fitch and S&P Global have us only one notch above. The growth outlook is a key consideration for all three agencies. Unfortunately, after the positive bounce in second quarter economic growth, the third quarter numbers from the major sectors so far have not been much to write home about.
On the positive side, the FNB/BER Building Confidence Index increased by four points to 38 in the third quarter. This still implies that more than 60% of respondents are unhappy with the current business environment. However, all but one of the sub-sectors registered higher confidence in the quarter, largely due to better margins.
The bright spot remains trade, where the July numbers have followed on from the good second quarter performance. South Africa’s current account deficit, a perennial Achilles’ heel, narrowed substantially to 3.1% of GDP in the second quarter as the trade balance swung into surplus with the income and services account deficit remaining broadly unchanged. The trade balance benefited from a surge in exports. Exports account for close to a third of GDP, meaning that an important area of the economy is growing above inflation.
For investors, there are two conclusions to be drawn. Firstly, the road to recovery for the South African economy is likely to be bumpy but it does appear that we are on it. Secondly, even though the JSE is historically expensive, there are areas of value that should enable our fund managers to eke out positive real returns from equities over time.
Chart 1: Banks and retailers relative to the FTSE/JSE All Share Index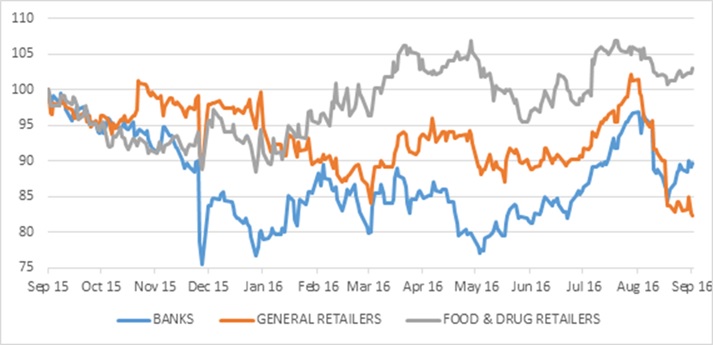
Source: Datastream
Chart 2: SA retail sales growth
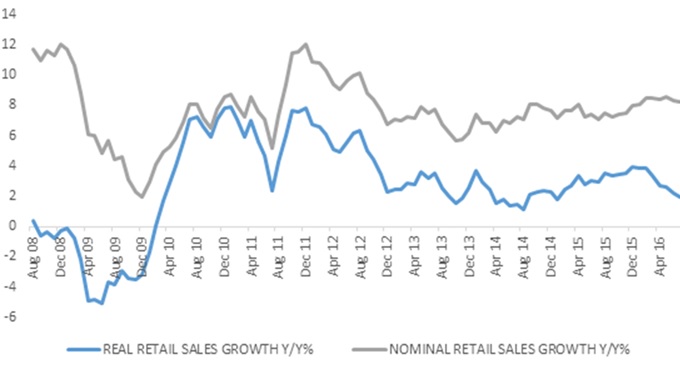
Source: StatsSA

