Decomposing US Treasury Yields - where will they surprise next?
Since the turn of the year markets have been very stressed for multiple reasons which our readers would be well familiar with.
Asset price movements have been impacted by risk-off sentiment, driven by concerns over global growth, mixed US economic data, rising worries over risk of further Chinese currency depreciation and ultimate repercussions of lending losses in the banking sector linked to commodity and oil producers to name but only a few factors. Additionally markets are fretting over both the efficacy and additional scope that exists within central bank monetary policy in the developed world to provide additional stimulus. A further question for debate is that question over the diminishing marginal returns from the adoption of additional QE and/or NIRP (negative interest rate policy).
More recently the BoJ has introduced (without any prior guidance) the adoption of tiered negative interest rates for banks to encourage lending in the real economy and also to reduce yields and ultimately borrowing costs. Surprisingly, this has served to strengthen and not weaken the Yen as we have grown accustomed to in reaction to BoJ announcements since 2014 under Abenomics. Flight to safety and concomitant USD weakness (in the short term) against G7 majors set in which seems to be a more dominant driver for Yen as recent Fed language shifts to more dovish in terms of monetary policy to be expected. Markets are now contemplating a pause by the Fed for several months and possibly by several quarters as they evaluate whether financial market fissures seen so far has any spillover impact and a more meaningful imprint in the real economy.
With that then as a backdrop we have seen bond markets benefit thus far in 2016 with US Treasury yields dropping sharply in a flight to safety environment, which has been a dominant theme, in conjunction with a re-setting of markets pricing of pace of Fed Rate hikes. More particularly Chart 1 below shows the degree to which UST yields have fallen since start of this year. For example, in the case of UST 10y yield has fallen by 55bp to near 1.65%, which is within striking distance of the record UST 10y low near 1.40 - a level seen last at the depths of the Global Financial Crisis extreme panic period of 2008. Below we take a look at decomposing this yield move to further delve into the move in yield levels and find what deeper analysis can reveal about Treasury yields. USTs are viewed as important in the sense they can be regarded as “risk free” sovereign benchmark yields that feed into or can be regarded as anchor yields for global fixed income markets given the size and liquidity of USTs, relevance in terms of Dodd-Frank regulations, Basel and other regulatory frameworks and market convention with many hard currency sovereigns issued in US and quoted over companion USTs.
Chart 1 – Decomposition of yield moves across US Treasuries curve since start of 2016 according to NY Fed Term Structure Model
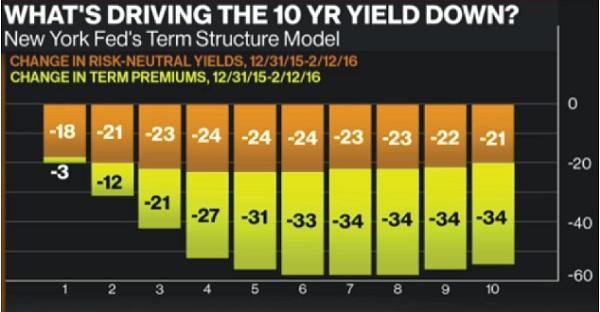
To understand the impact of changes in the federal funds rate on other interest rates, we find it helpful to decompose Treasury yields into two underlying components, the risk-neutral yield (RNY) and the term premium (TP). The risk-neutral rate is the interest rate equal to the expected return from continuously rolling over short-maturity Treasury Bills. Hence, the risk-neutral rate is the expected average short term interest rate over the life of a longer-term bond. The term premium, on the other hand, is the residual. We assume that Treasuries carry no default risk, as is common in both theory and practice. This residual is, therefore, the compensation investors receive for the risk associated with short-term rates behaving differently in the future than currently expected. Essentially it can be explained as a ‘catch-all’ phrase for all risks premia embedded in bond yields that are over and beyond expected inflation and short term path of policy rates priced by the market.
For example, an investor buying a longer-term bond would be concerned about the risk that short-term rates end up being higher than the expected path currently discounted into the risk neutral rate, which would negatively affect the price of the bond held by the investor. Because the term premium and risk-neutral rates are not directly observable, they must be estimated and there are numerous ways of achieving this. The New York Fed computes and publishes RNY and TP data for USTs from 1 year to 10 year UST tenors - the so-called ACM Model.(*)
ACM Model (New York Fed economists Tobias Adrian, Richard Crump, and Emanuel Moench (or "ACM"). https://www.newyorkfed.org/research/data_indicators/term_premia.html
Chart 2 – ACM Term Premium Model – UST 10yr Risk Neutral Yield has declined ~20bp since start of 2016 as market prices out pace of Fed rate hikes
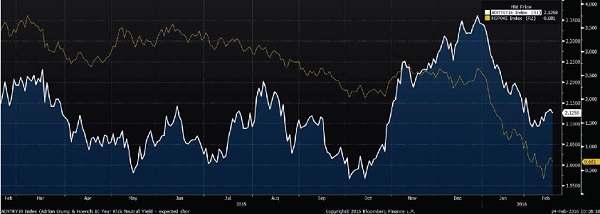
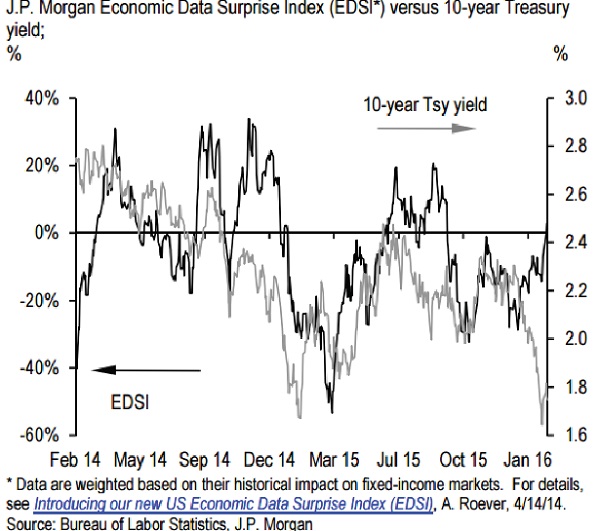
The chart above (Chart 2) illustrates the markets pricing for pace and degree of Fed hikes over a 12 month cycle (the MS POKE indicator) and the ACM New York Fed Term Premium Model estimate of Risk Neutral Yield for UST 10year T-Note. As most readers are aware markets have priced lower expectations of Fed hikes since start of this year following the recent market volatility. MSPOKE in yellow on chart 2 shows at the start of 2016 there were more than 2 hikes of 25bp hikes priced for 2016 (meaning a Fed Funds rate of 37.5bp+62.5bp=1% by end 2016.) At the current juncture, this has now been reset lower by markets to only 0.68*25=17bp worth of hikes over coming 12 months. Alternatively phrased the market is not looking for Fed to hike again by 25bp until sometime in Q1 2017, which will be unrealistic should US economic data remain resilient or even improve further (See Chart 3 – JP Morgan EDSI index has now turned positive for the US.) The white line on chart 4 below shows the NY Fed ACM Model RNY for 10y UST falling some 21p since start of year to 2.12% from 2.33% as we entered the year more which equates to a or less equal to lowering of fed hike expectations over the same period as measured by MSPOKE.
Chart 3 – US Economic Data has been beating expectation recently, but yields remain at very low levels as traditional correlation breaks down
Next we look a little closer at the term premium. This historically has been the big driver of long term rates. Jeremy Stein, Economics Professor at Harvard, once said that if you want to look at what moves long rates, then look at or study the term premium. The natural question arises then as to what drives the term premium? Historically it has averaged around 150bp for UST10y over the life of data available for Fed ACM Model since 1961. Note that even in the post-GFC period the Term Premium average for USST 10y has been 110bp (1.1%) Currently we observe that the TP has turned negative for UST 10y and at -30bp most recent reading for this metric is less than 10bp from the all time lowest term premium observed across the full panel of data. (see Chart 4 – white line)
Fed Chairman Ben Bernanke outlined five contributors to impact on shifts in term premium in a famous speech on 1 March 2013 a few months before the so called ‘Taper Tantrum’ happened. The Fed’s asset purchases or QE is only one of them. The others are yield/market volatility, correlation with equities which has turned negative in recent years, safe haven flows in periods of market turmoil and recycling effects of foreign funds into USTs from current account surplus countries. We would argue that given the aggressive QE stimulus and other monetary policy measures adopted by BoJ and ECB that more recently includes NIRP (Negative Interest Rate) policies resulting in markets having to re-assess the lower bound for policy rates, there may be a 6th important factor at work that works towards the lowering of the term premium. Central to this result is that the relative value that 10y USTs offer on absolute basis to sovereign wealth funds, central banks and real money investors over similarly dated bunds and JGBs continue to help support demand for USTs and in turn lower the TP.
It may seem intuitive that the term premium should be positive. Why would anyone accept a return lower than that expected from rolling over short-term, risk-free bonds? However, this is not necessarily the case. Consider an investor, such as a pension fund or life insurance company, which has liabilities in the future, meaning its concern would be falling interest rates and the associated reinvestment risk. Falling rates would make it more difficult to meet liabilities when it reinvests at lower interest rates, so the firm would prefer to extend its duration and lock in the current rate for an extended period of time. This investor may be willing to accept a yield lower than the risk-neutral rate in order to remove the reinvestment risk it would face from a lower than-expected trajectory of short-term rates. Although term premia can be negative, the figures below show they are generally positive. We do observe a long-term decline experienced in both term premia and risk-neutral rates if we chart the full dataset available since 1961. There are many reasons for this decline, including lower and more stable inflation, demographics, the emergence of global capital markets and numerous other structural factors. (**)
Work by Wells Fargo Economists Sival, Iqbal, Moehring (May 2015)** shows strong positive correlation/relationship between RNY and upward surprises in Fed Funds Rate. As market therefore prices around Fed so called DOT-PLOT /Dots we should see RNY rise/fall as a result, which makes intuitive sense. The literature is less clear on whether positive surprises in Fed funds rate (fed hikes fast) results in lower or higher term risk premium (TP) in yields.
** Fed Funds Surprises & Treasury Yields: Part 2, Wells Fargo Securities (May 2015)
Chart 4 – Term Premium in US Yield Curve has traditionally been correlated with Yield Volatility (MOVE Index – Merrill Lynch Option Volatility Estimate)
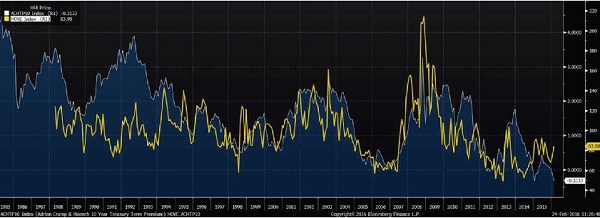
So we find ourselves then at a new frontier where the market may be soon be boldly repricing the US term premium back into positive territory as US economic data rebounds in the months ahead and UST yields rise to more accurately reflect US economic realities and emboldened by Fed re-iteration of their firm commitment towards monetary policy normalization. This Fed policy is asynchronous to the monetary policy of the rest of developed world central banks. Alternatively yields may compress further as we remain stuck in a landscape where the bumpy rebalancing in China, additional renminbi depreciation and deflationary forces which is one of the outcomes of current currency “wars” continue to remain the central scenario leading to falling term premia, also supported by ECB actions to pursue deeper NIRP policies (as early as March 2015) and a continuation of ECB QE (which pushes Bund term structure further down and 10yr bunds yields into negative territory). This is indeed possible and recall that we saw for the first time earlier this week that 10y JGBs in Japan turned negative, dipping below a zero yield for the first time.
Our view is that over time structural forces which dominate may continue to act as downward drag on USTs via the term premium in particular, however in short term we feel it would be dangerous to ignore the fact that term premia are so negative across the US yield curve (sitting at historic all time lows). This implies there is little historical precedent for value in UST at current levels despite the bullish backdrop. Moreover even if term premia remain low and negative it is unlikely that risk-off periods and a flight to safe haven or quality persists will; lead to further and deeper moves into negative terrain. If this were to happen it will in all likelihood need to be tied to more broader adoption of NIRP policies globally which forces core bond market yield curves structurally lower with front end yields substantially more negative. This will have to be closely watched.
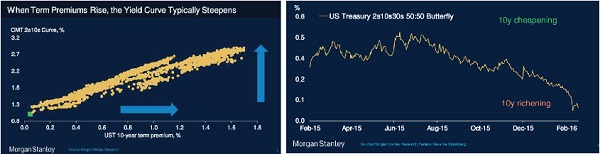
It is therefore our view to proceed cautiously and prefer better entry levels in bonds markets once a sell-off has occurred which may restore some positive UST Term Premia and by extension other fixed income markets. Such a move could be driven by anything from upward surprising US data to jawboning by the Fed and other central banks such as ECB and BoJ adding to heightened yield volatility. In fact former Fed Chair Bernanke did indeed once write (Brookings Institute) that Term Premia (TP) is positively correlated with implied volatilities of US Treasury options as measured by the MOVE index (see chart 4). This also suggests that term premia is probably currently too low at current levels as it has fallen further into negative terrain while the MOVE index has been rising of late (Chart 4). Chart 5, panel A leads us to expect US yield curve to steepen once the TP rises and that this may be well monetised as a trade with a butterfly trade paying the belly of the curve versus the short and long ends (2v10v30) (see Chart 5 – Panel B).
Chart 5 – US Term Structure of USTs positively correlated with rise in Term Premia (Panel A) This suggests paying belly if 2v10v30 UST fly makes sense should term premia begin to normalise (Panel B)