
Asset classes: which were the top performers in 2014?

Shaun Ruiters, head of strategy and client solutions at Sanlam Investments Retail Business.
For several asset classes, 2014 was a race in which everything started to change at the halfway- mark. Domestic equity was first out of the blocks and beat all other asset classes up to June, but shortly afterwards it was lapsed by domestic real estate, which took the laurels for the calendar year.
On a global level, optimism peaked during the first half of the year as the world economy started showing signs of a stronger growth trajectory, led by the United States. However, the second half of the year produced greater risk aversion and volatility as Europe continued to struggle and inflation and growth prospects dwindled, while Japan entered yet another recession. In addition, Chinese economic growth lost some momentum, which dented commodity prices from a demand perspective and weakened commodity shares, as well as commodity currencies, such as the rand.
Show me the numbers
The top performing asset class for the year was SA Real Estate (26.6%), with Foreign Equity following at 15.9% for the year. The most pedestrian performance of the year was delivered by SA Cash, returning 5.9%:
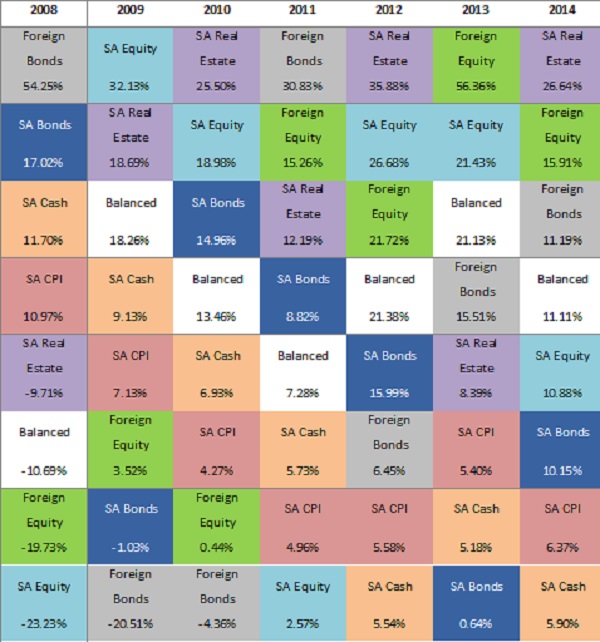
Source: Sanlam Investments (Jan 2015)
Sentiment drives property
Extremes in sentiments certainly made the year tricky, while property defied valuations to continue to create new highs. Property rallied strongly to end as the best performing asset class over the year despite being the worst performing asset class at the beginning of the year.
Not a great year for emerging markets
Emerging markets significantly underperformed over the second half of the year, with slowdowns and negative revisions in many large emerging markets, including Russia, China, Brazil and South Africa. The dramatic fall in the oil price assisted in flaming deflationary fears, and hampered countries such as Russia even further.
The year on a sectoral level
Looking at the performance in the South African market in greater detail, one can see how the fortunes of the first half of the year reversed after June:
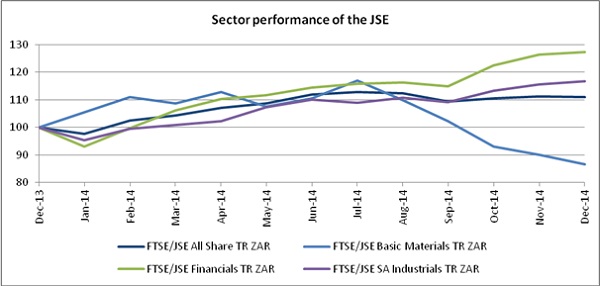
Source: Morningstar Direct (Jan 2015)
The year on a share level
Looking at the local stock market, these were the best and worst performing stocks in 2014:
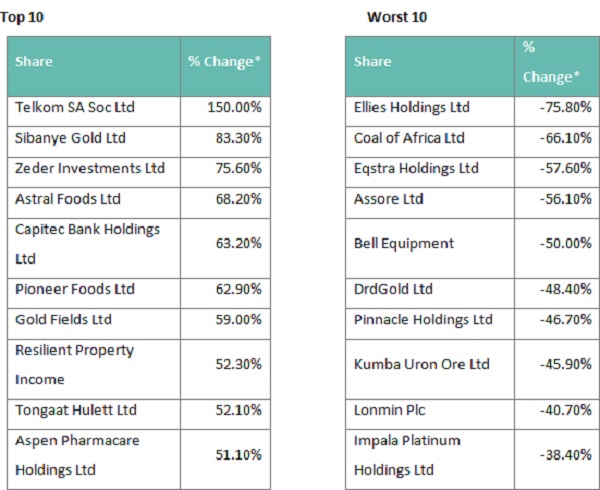
Source: Bloomberg | *from closing price 31/12/2013 to 31/12/2014
A year in halves for unit trust investors
Looking at the categories of the Association for Savings and Investment South Africa (ASISA), the difference in performance for the two periods January to June 2014 and July to December 2014 was most marked for the following ASISA categories. The resource sector had the greatest difference in performance.
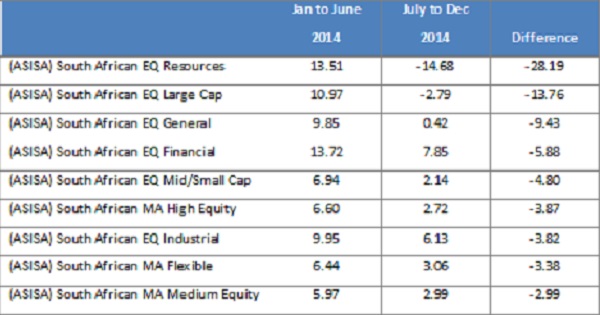
Source: MorningStar Direct | SI Calculations (Jan 2015)
The change in sentiment in the second half of the year comes through in the performance of the various investment styles. Where the value style made significant gains in the early months, this was quickly reversed in the second half of the year. Factors such as quality and momentum continued to produce the results which we have seen since the end of 2011.
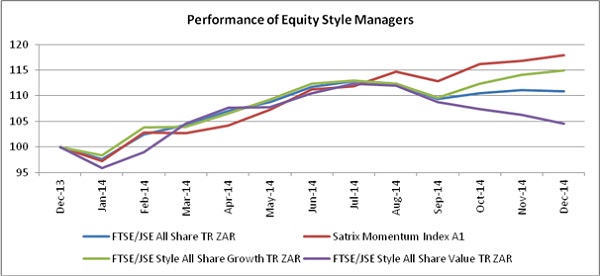
Source: Morningstar Direct (Jan 2015)
Keeping perspective
While performance figures will always pique the interest of investor and fund manager alike, we remind investors to remain committed to their long-term investment goals and to not make decisions based on performances as short as one year.
