
September 2014 – etfSA.co.za monthly South African ETF, ETN and Unit Trust passive index tracking performance survey
The Performance Survey of all index tracking unit trusts/ETPs available to the retail investor public in South Africa, is attached for the period ended 30th September 2014.
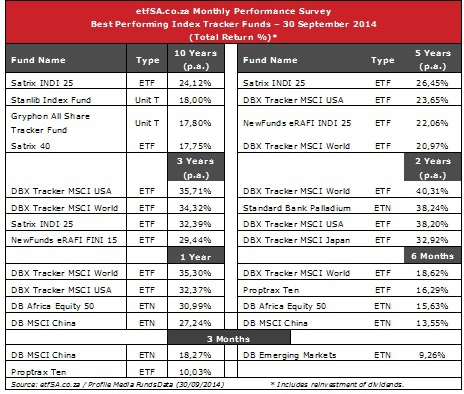
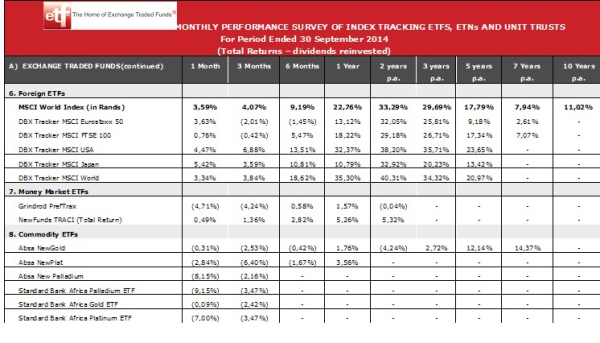
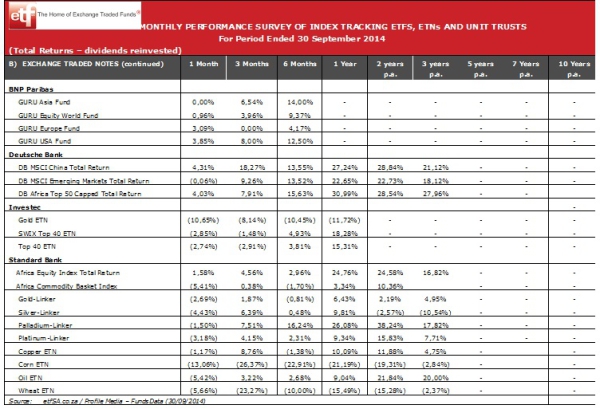
With the equity markets experiencing a phase of correction, somewhat long overdue, given the almost uninterrupted rise in equity markets worldwide this year, it is difficult to gauge any patterns from the current price indicators. Rand hedge indices, notably the DBX Tracker ETFs and ETNs, are prominent in the performance tables, indicating that the rand depreciation might be the dominant factor in the local market at present.
When equity market recovery takes place, the local rand hedge indices could be key beneficiaries.
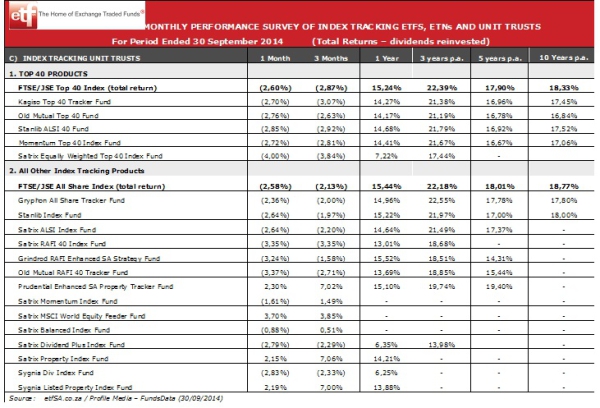
The Grindrod Bank Proptrax Ten ETF is showing good returns for the past 3 and 6 months, particularly in comparison with other property tracker funds. The PropTrax Ten ETF tracks an index of the largest 10 listed property shares on the JSE, so effectively reflects the consolidation and expansion taking place amongst the largest domestic property companies.
A summary of the best performing index trackers over periods of 3 months to 10 years is shown below. The full Performance Survey of all index tracking passive products is attached.
Summary Table
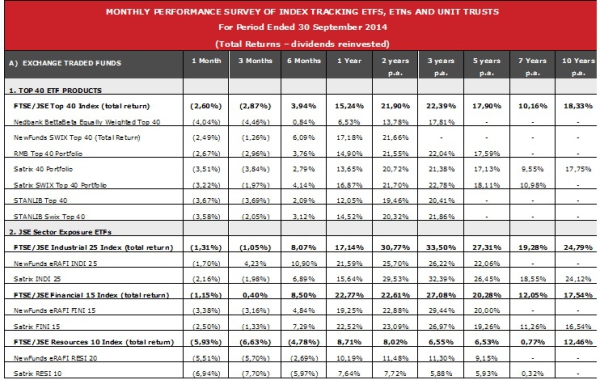
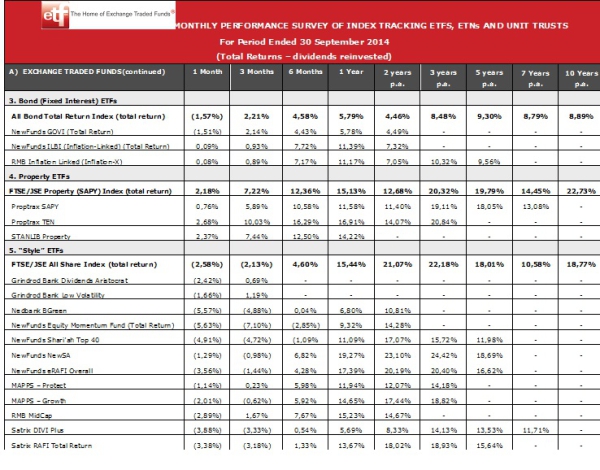
The etfSA.co.za Performance Survey measures the total return (Net Asset Value (NAV to NAV)) changes including reinvestment of dividends) for index tracking unit trusts and Exchange Traded Funds (ETFs) available to the retail public in South Africa. The performance tables (attached) measure the 1 month to 5 years total return for a lump sum investment compared with the benchmark index returns (including reinvestment of dividends). All indices are shown in total return format. Note, as the FTSE/JSE calculates the index without taking into account any brokerage or other transaction costs, index tracking products will typically underperform the index because of their transaction and other running costs. Please Note: future performance will not necessarily repeat historic performance data.
Terms and conditions: Redistribution, reproduction, the resale or transmission to any third party of the contents of this article and this website, whether by email, newsletter, internet or website, is only possible with the written permission of etfSA.co.za. etfSA.co.za, its sponsors, administrators, contributors and product providers disclaim any liability for any loss, damage, or expense that might occur from the use of or reliance on the data and services provided through this website. etfSA.co.za is the registered trading name of M F Brown, an authorised Financial Services Provider (FSP No 39217). etfSA.co.za is licensed to provide financial services in the following categories: Collective Investment Schemes; Shares and Securities; Retail Pension Fund Benefits; Short-Term deposits; and Friendly Society Benefits. Professional Indemnity Insurance is maintained. etfSA.co.za®, and etfSA The Home of Exchange Traded Funds® are registered trademarks in the Republic of South Africa.
The etfSA Performance Survey measures the total return (Net Asset Value (NAV to NAV)) changes including reinvestment of dividends) for index tracking unit trusts and Exchange Traded Funds (ETFs) available to the retail public in South Africa. The performance tables measure the 1 month to 5 years total return for a lump sum investment compared with the benchmark index returns (including reinvestment of dividends). All indices are shown in total return format. Note, as the FTSE/JSE calculates the index without taking into account any brokerage or other transaction costs, index tracking products will typically underperform the index because of their transaction and other running costs.
Please Note: future performance will not necessarily repeat historic performance data.

