
September 2013 – etfSA.co.za monthly South African ETF, ETN and Unit Trust Index Tracking performance survey
03 October 2013 | Investments | ETF's (Exchange Traded Funds) | Mike Brown, etfSA.co.za
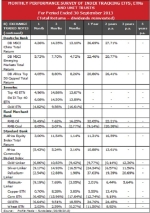
After some years of ruling the roost as the top performing index tracking fund for the medium-term periods (2-5 years), the Satrix INDI 25 ETF has been knocked off its perch in the 3 years performance survey by the DBX Tracker MSCI 600 USA ETF. Both of these ETFs track indices of predominantly industrial shares.
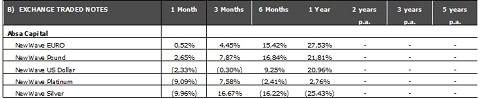
The Satrix INDI 25 ETF is still the best passive performing index tracker over the 5 year and 2 year periods. However, the DBX Tracker ETF funds, providing access to various international stockmarkets, dominate the other top places in the performance tables. Clearly, rand hedge products have been the place to be over the past three years (the Satrix INDI has a very high rand hedge component).
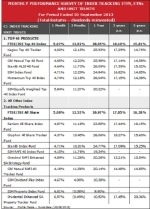
For the first time since the Monthly Performance Survey began in 2010, resource tracker funds have appeared at the top of the performance tables, even if only for the 3 month period. The NewFunds eRAFI Resources 20 ETF and the Satrix RESI 10 ETF, indicate that a recovery in the commodity cycle may be beckoning. Exchange Traded Products, tracking the various commodity markets should be closely monitored in coming months.
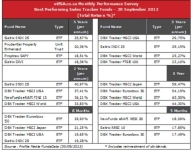
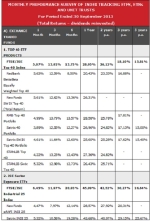
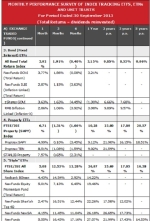
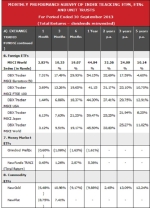
The etfSA.co.za Performance Survey measures the total return (Net Asset Value (NAV to NAV)) changes including reinvestment of dividends) for index tracking unit trusts and Exchange Traded Funds (ETFs) available to the retail public in South Africa. The performance tables (attached) measure the 1 month to 5 years total return for a lump sum investment compared with the benchmark index returns (including reinvestment of dividends). All indices are shown in total return format. Note, as the FTSE/JSE calculates the index without taking into account any brokerage or other transaction costs, index tracking products will typically underperform the index because of their transaction and other running costs. Please Note: future performance will not necessarily repeat historic performance data.
Terms and conditions: Redistribution, reproduction, the resale or transmission to any third party of the contents of this article and this website, whether by email, newsletter, internet or website, is only possible with the written permission of etfSA.co.za. etfSA.co.za, its sponsors, administrators, contributors and product providers disclaim any liability for any loss, damage, or expense that might occur from the use of or reliance on the data and services provided through this website. etfSA.co.za is the registered trading name of M F Brown, an authorised Financial Services Provider (FSP No 39217). etfSA.co.za is licensed to provide financial services in the following categories: Collective Investment Schemes; Shares and Securities; Retail Pension Fund Benefits; Short-Term deposits; and Friendly Society Benefits. Professional Indemnity Insurance is maintained. etfSA.co.za®, and etfSA The Home of Exchange Traded Funds® are registered trademarks in the Republic of South Africa.
The etfSA Performance Survey measures the total return (Net Asset Value (NAV to NAV)) changes including reinvestment of dividends) for index tracking unit trusts and Exchange Traded Funds (ETFs) available to the retail public in South Africa. The performance tables measure the 1 month to 5 years total return for a lump sum investment compared with the benchmark index returns (including reinvestment of dividends). All indices are shown in total return format. Note, as the FTSE/JSE calculates the index without taking into account any brokerage or other transaction costs, index tracking products will typically underperform the index because of their transaction and other running costs.
Please Note: future performance will not necessarily repeat historic performance data.

