
June 2014 – etfSA.co.za monthly South African ETF, ETN and unit trust passive index tracking performance survey
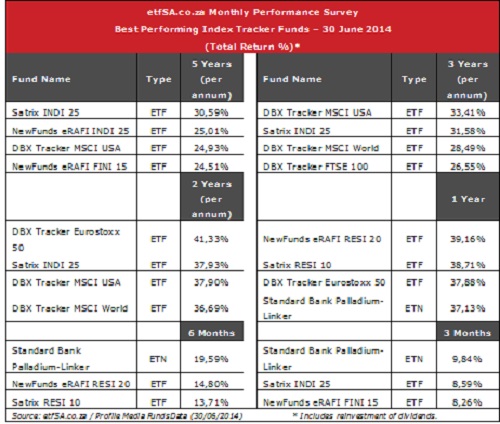
The latest Performance survey highlights the continued good performance of market capitalisation equity indices that track both domestic and foreign equity markets.
In the domestic equity market, the Satrix INDI 25 ETF, remains king. Continuous foreign and local investment flows into the large capitalisation industrial shares, have made the industrial index the real benchmark for the South African market.
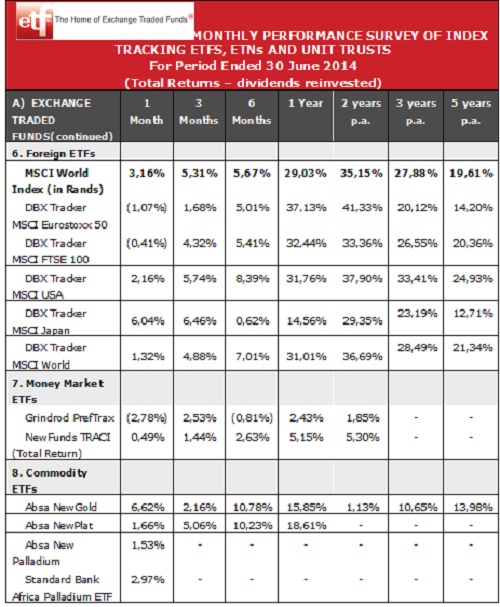
The DBX (Deutsche Bank) Tracker ETFs that provide direct access to the main international equity indices, but trade in rands as “inward investments” on the JSE, are an ideal means of exposure to global markets. They are not constrained by the asset swap capacity, tax clearance and exchange control requirements that add complexity, costs and scalability problems for competitive foreign access investments. The various DBX Tracker ETFs dominated the 1 to 3 year performance returns in the latest performance survey.
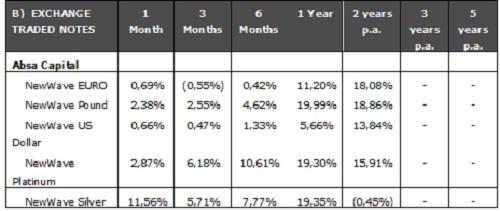
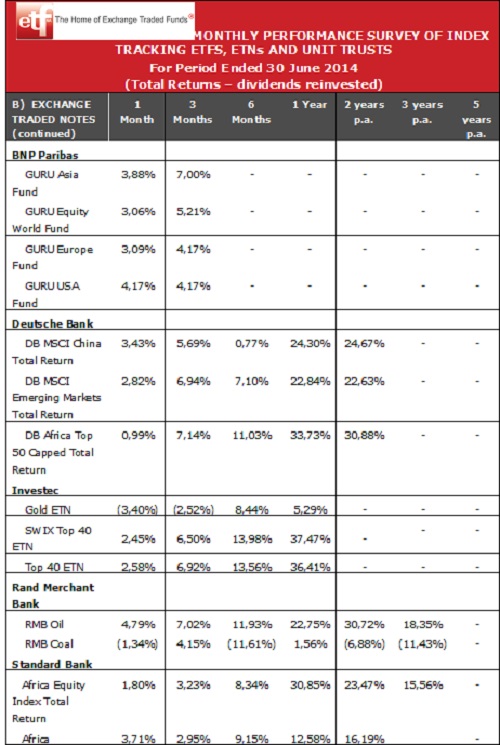
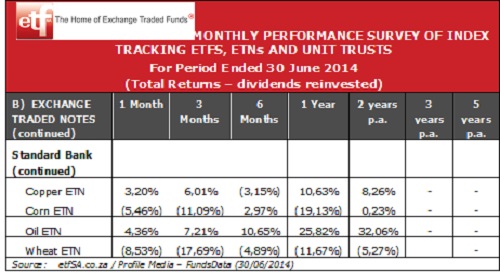
The Standard Bank Palladium-Linker ETN, which invests in palladium futures contracts, is the best performing index tracker for 3 and 6 months and in the top four for 12 months. This good performance has probably been the reason for both Standard Bank and Absa Bank bringing out fully physically-backed Palladium ETFs in recent months.
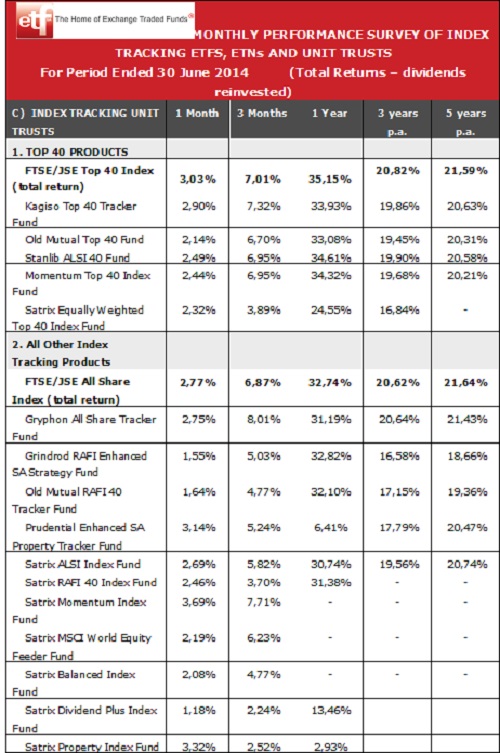
Summary Table
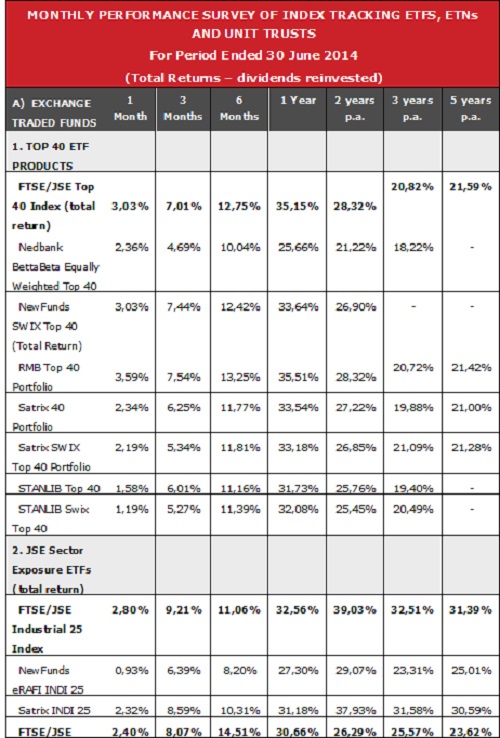
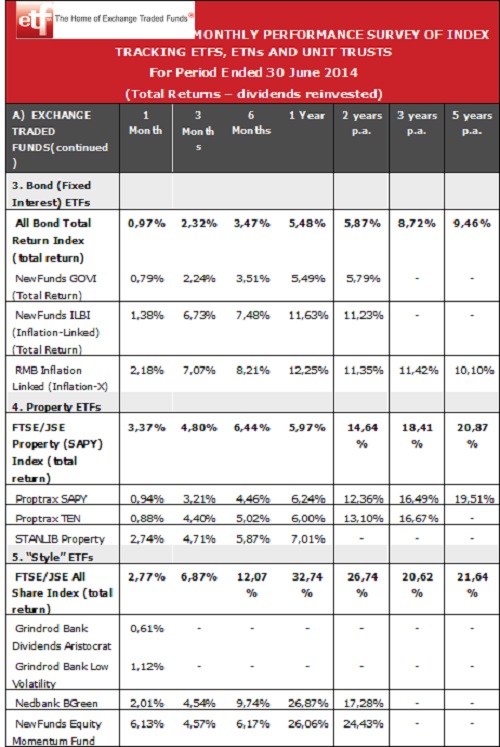
The etfSA.co.za Performance Survey measures the total return (Net Asset Value (NAV to NAV)) changes including reinvestment of dividends) for index tracking unit trusts and Exchange Traded Funds (ETFs) available to the retail public in South Africa. The performance tables (attached) measure the 1 month to 5 years total return for a lump sum investment compared with the benchmark index returns (including reinvestment of dividends). All indices are shown in total return format. Note, as the FTSE/JSE calculates the index without taking into account any brokerage or other transaction costs, index tracking products will typically underperform the index because of their transaction and other running costs. Please Note: future performance will not necessarily repeat historic performance data.
Terms and conditions: Redistribution, reproduction, the resale or transmission to any third party of the contents of this article and this website, whether by email, newsletter, internet or website, is only possible with the written permission of etfSA.co.za. etfSA.co.za, its sponsors, administrators, contributors and product providers disclaim any liability for any loss, damage, or expense that might occur from the use of or reliance on the data and services provided through this website. etfSA.co.za is the registered trading name of M F Brown, an authorised Financial Services Provider (FSP No 39217). etfSA.co.za is licensed to provide financial services in the following categories: Collective Investment Schemes; Shares and Securities; Retail Pension Fund Benefits; Short-Term deposits; and Friendly Society Benefits. Professional Indemnity Insurance is maintained. etfSA.co.za®, and etfSA The Home of Exchange Traded Funds® are registered trademarks in the Republic of South Africa.
The etfSA Performance Survey measures the total return (Net Asset Value (NAV to NAV)) changes including reinvestment of dividends) for index tracking unit trusts and Exchange Traded Funds (ETFs) available to the retail public in South Africa. The performance tables measure the 1 month to 5 years total return for a lump sum investment compared with the benchmark index returns (including reinvestment of dividends). All indices are shown in total return format. Note, as the FTSE/JSE calculates the index without taking into account any brokerage or other transaction costs, index tracking products will typically underperform the index because of their transaction and other running costs.
Please Note: future performance will not necessarily repeat historic performance data.

