
January 2014 – etfSA.co.za monthly South African ETF, ETN and unit trust index tracking performance survey
05 February 2014 | Investments | ETF's (Exchange Traded Funds) | Mike Brown, etfSA.co.za
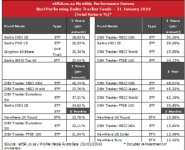
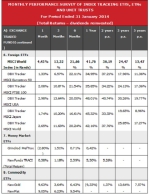
The 5 year performance rankings are still dominated by the local equity market index trackers. The Satrix INDI 25 ETF is the top performer, with an annual return of 28,83% over the past 5 years. For the first time, since the Performance Survey was started in 2010, a general equity unit trust index tracker, the Gryphon All Share Index Tracker, with an annual return of 20,34%, enters the long-term performance rankings. This may be a sign that the unit trust index tracking industry is finally getting its act together in delivering less tracking error performance at low cost.
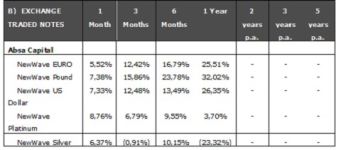
For the other periods surveyed, from 3 months to 3 years, offshore ETPs dominate the performance rankings. For the first time Currency ETNs, the New Pound ETN, the NewWave US Dollar ETN and the NewWave Euro ETN, which offers direct access to offshore deposits in the major currencies, show up in the performance rankings for the 3 month and 6 month periods.
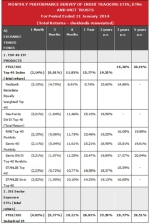
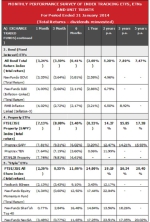
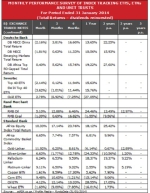
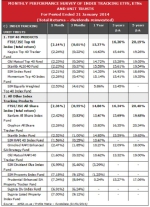
The full Performance Survey of all 63 listed ETPs and 17 index tracker unit trusts is attached.
Summary Table
The etfSA.co.za Performance Survey measures the total return (Net Asset Value (NAV to NAV)) changes including reinvestment of dividends) for index tracking unit trusts and Exchange Traded Funds (ETFs) available to the retail public in South Africa. The performance tables (attached) measure the 1 month to 5 years total return for a lump sum investment compared with the benchmark index returns (including reinvestment of dividends). All indices are shown in total return format. Note, as the FTSE/JSE calculates the index without taking into account any brokerage or other transaction costs, index tracking products will typically underperform the index because of their transaction and other running costs. Please Note: future performance will not necessarily repeat historic performance data.
Terms and conditions: Redistribution, reproduction, the resale or transmission to any third party of the contents of this article and this website, whether by email, newsletter, internet or website, is only possible with the written permission of etfSA.co.za. etfSA.co.za, its sponsors, administrators, contributors and product providers disclaim any liability for any loss, damage, or expense that might occur from the use of or reliance on the data and services provided through this website. etfSA.co.za is the registered trading name of M F Brown, an authorised Financial Services Provider (FSP No 39217). etfSA.co.za is licensed to provide financial services in the following categories: Collective Investment Schemes; Shares and Securities; Retail Pension Fund Benefits; Short-Term deposits; and Friendly Society Benefits. Professional Indemnity Insurance is maintained. etfSA.co.za®, and etfSA The Home of Exchange Traded Funds® are registered trademarks in the Republic of South Africa.
The etfSA Performance Survey measures the total return (Net Asset Value (NAV to NAV)) changes including reinvestment of dividends) for index tracking unit trusts and Exchange Traded Funds (ETFs) available to the retail public in South Africa. The performance tables measure the 1 month to 5 years total return for a lump sum investment compared with the benchmark index returns (including reinvestment of dividends). All indices are shown in total return format. Note, as the FTSE/JSE calculates the index without taking into account any brokerage or other transaction costs, index tracking products will typically underperform the index because of their transaction and other running costs.
Please Note: future performance will not necessarily repeat historic performance data.

