
December 2014 – etfSA.co.za monthly South African ETF, ETN and Unit Trust Passive Index Tracking performance

Mike Brown, Managing Director, etfSA.co.za.
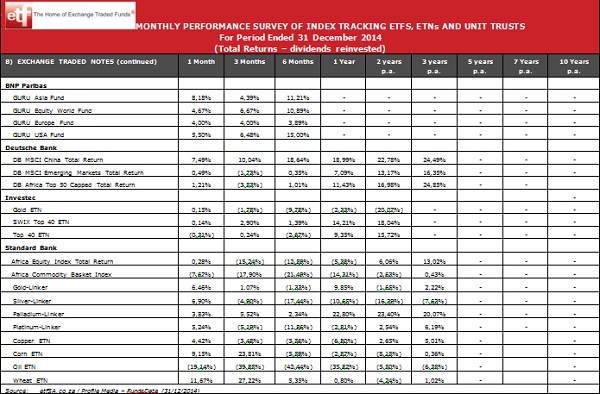
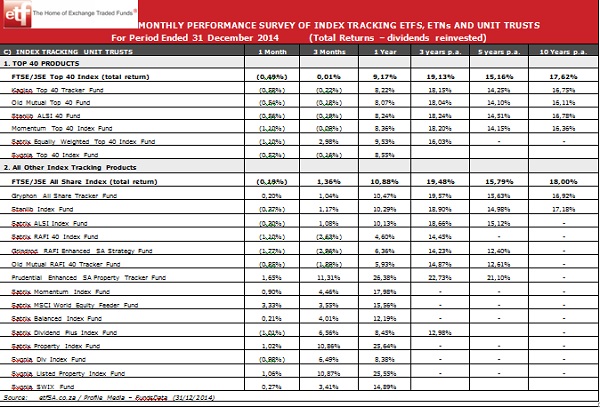
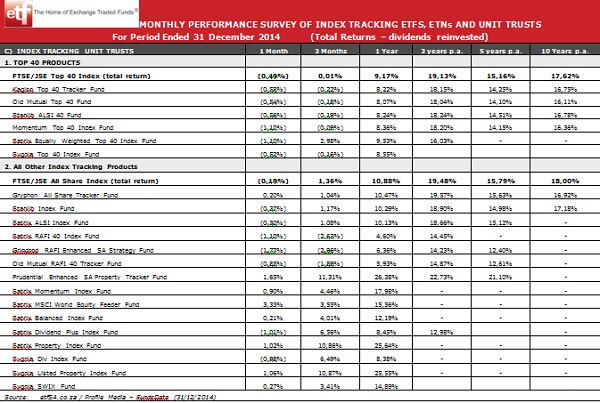
The Performance Survey for the year ended 31 December 2014, is attached. There were difficult trading conditions during the year for many investment markets, with volatility dominating over the past few months of 2014. The FTSE/JSE Top 40 index only returned 9,17% for the full year ended 31 December 2014, bringing to an end the dominant equity markets of the previous two years. However, a significant number of index tracking products produced better performance than the overall market last year, 35 out of a total of 90 passive products, in fact, showing that the correct selection of an index is critical.
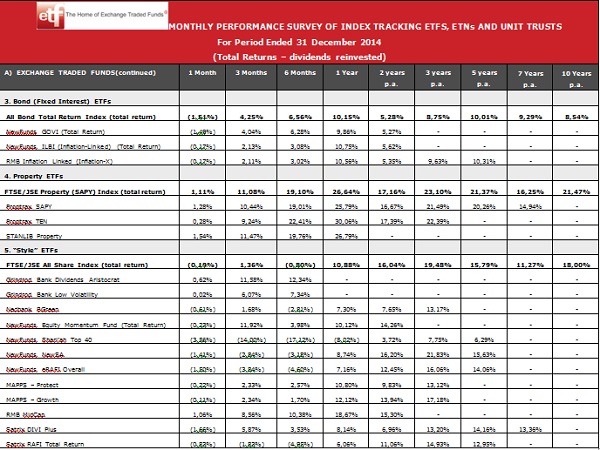
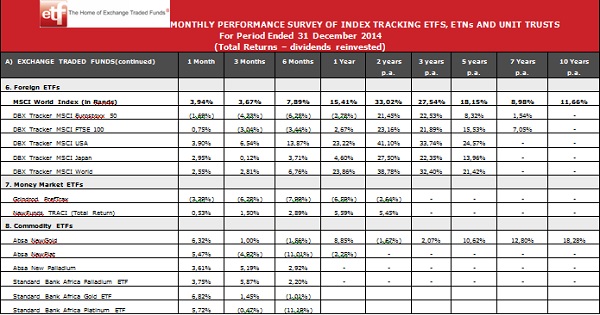
The longer-term performance, from 3-10 years, suggests that focus on rand hedge investments, industrial, financial and property shares has been well rewarded. The one year performance returns were dominated by property index trackers, led by the Proptrax Ten ETF which recorded a 30,06% total return.
Summary Table
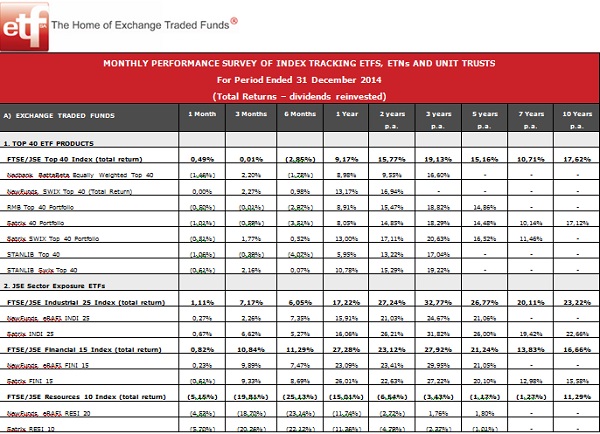
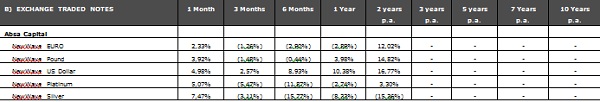
The etfSA.co.za Performance Survey measures the total return (Net Asset Value (NAV to NAV)) changes including reinvestment of dividends) for index tracking unit trusts and Exchange Traded Funds (ETFs) available to the retail public in South Africa. The performance tables (attached) measure the 1 month to 10 years total return for a lump sum investment compared with the benchmark index returns (including reinvestment of dividends). All indices are shown in total return format. Note, as the FTSE/JSE calculates the index without taking into account any brokerage or other transaction costs, index tracking products will typically slightly underperform the index because of their transaction and other running costs.
Please Note: future investment performance will not necessarily replicate historic performance data. All data used in the Survey is sourced from Profile Media, who obtain daily data from all index tracker product issuers.
Terms and conditions: Redistribution, reproduction, the resale or transmission to any third party of the contents of this article and this website, whether by email, newsletter, internet or website, is only possible with the written permission of etfSA.co.za. etfSA.co.za, its sponsors, administrators, contributors and product providers disclaim any liability for any loss, damage, or expense that might occur from the use of or reliance on the data and services provided through this website. etfSA.co.za is the registered trading name of M F Brown, an authorised Financial Services Provider (FSP No 39217). etfSA.co.za is licensed to provide financial services in the following categories: Collective Investment Schemes; Shares and Securities; Retail Pension Fund Benefits; Short-Term deposits; and Friendly Society Benefits. Professional Indemnity Insurance is maintained. etfSA.co.za®, and etfSA The Home of Exchange Traded Funds® are registered trademarks in the Republic of South Africa.
The etfSA Performance Survey measures the total return (Net Asset Value (NAV to NAV)) changes including reinvestment of dividends) for index tracking unit trusts and Exchange Traded Funds (ETFs) available to the retail public in South Africa. The performance tables measure the 1 month to 10 years total return for a lump sum investment compared with the benchmark index returns (including reinvestment of dividends). All indices are shown in total return format. Note, as the FTSE/JSE calculates the index without taking into account any brokerage or other transaction costs, index tracking products will typically slightly underperform the index because of their transaction and other running costs.
Please Note: future investment performance will not necessarily replicate historic performance data. All data used in the Survey is sourced from Profile Media, who obtain daily data from all index tracker product issuers.

