Can Multi-Asset Unit Trusts Outperform Multi-Asset Portfolios Using Passive Exchange Traded Products?
Summary
The significant flow of retail investment money into Unit Trusts that provide portfolios spread amongst different asset classes in South Africa in recent times has been phenomenal. The total assets under management in multi-asset funds has increased from R352 million at 30 September 2012 to R541 million as at 30 June 2013, during which period, flows to other areas of the Unit Trust industry have stagnated.
However, there are increasing concerns being expressed in the industry and by investors about the relatively poor performance of such multi-asset funds and, in particular, about the high costs that are associated with these multi-management portfolios.
One way of investigating this is to replicate the methodology of multi-asset managers by using passive investment Exchange Traded Products (ETPs) to provide exactly the same asset allocation as the multi-asset Unit Trusts.
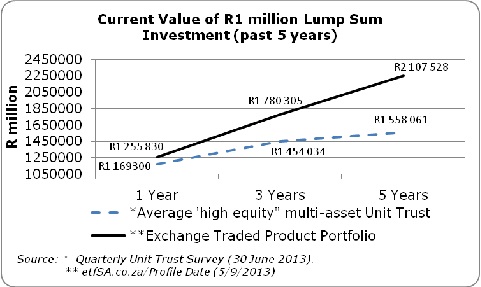
The graph below shows the difference between an investment of R1 million made, at the average return, of all the 107 Unit Trusts reporting in the “high equity” multi-asset section of the Quarterly Unit Trust Survey and the returns from the same investment into a portfolio of ETPs with exactly the same asset allocation.
The Unit Trust investment would have risen from R1 million to R1 454 034 after 3 years and to R1 558 061 after 5 years. Over the same period, the ETP investment would have appreciated to R1 780 305 after 3 years and to R2 107 528 after 5 years. Clearly the performance benefits reaped by using low cost simple passive ETPs to provide multi-asset investment solutions are considerable.
Please note: Historic returns may not be fully replicated in future.
The further the time period of investment, the greater the return on the index-tracking investment, which exactly replicates the actively managed Unit Trust group. What explains the growing “jaws” between the passive and actively managed options?
• Costs are compounded over time – the average TER of the 6 ETFs used in the passive portfolio (shown in the table below), is 0,52% per annum. The average TER of all the high equity multi-asset Unit Trusts is 1,92%. Higher costs compound over time to destroy investment performance.
There is also a growing suspicion that other costs including: performance fees; “churn” costs, i.e. the brokerage and STT associated with constant portfolio churn; hidden distribution costs; loyalty fees; etc, are not being fully disclosed by many Unit Trust managers. This would account for the relatively poor investment performance.
• Active selection of shares does not add value – both the multi-asset Unit trusts and the ETPs have exactly the same asset allocation, so this cannot account for the differentiation in performance. It would appear that the active selection of shares to deliver multi-asset performance may not really add value.
Using index tracking products as the building blocks of a multi-asset portfolio creates greater performance consistency, plus less volatility (measured by the standard deviation against the benchmark), as the ETPs are the benchmark (less TERs). By using passive products to accurately and cheaply deliver the performance of each asset class, there is a big benefit in performance, particularly over extended periods of time.
To conclude, as passive investment methods and products become increasingly known and sought after, the benefits of constructing multi-asset “balanced” portfolios, using ETPs as the building blocks, is clearly worthy of consideration. The low costs, less risk and greater transparency of Exchange Traded Products works in favour of the longer-term investor. This makes these products particularly suitable for retirement investments.
APPENDIX - METHODOLOGY
The pie chart indicates an estimate of the average asset allocation of all 107 Unit Trusts in the high equity multi-asset section of the Unit Trust Survey (June 2013).
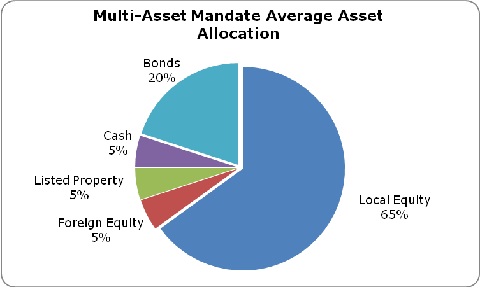
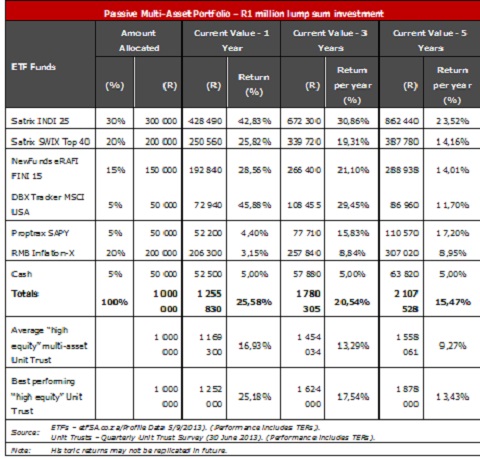
This asset allocation is replicated, utilising Exchange Traded Products (ETPs), as shown in the Table below. Six different ETPs are chosen to give access to the performance of these different asset classes. The holding in cash is not allocated to an ETF, and the average return of cash deposits is utilised.
The Table below shows the performance of the “balanced” ETP portfolio versus the average return of the high equity multi-asset Unit Trust funds as well as the performance of the best performing Unit Trust fund in this sector. Although the best performing multi-asset Unit Trust was able to match the performance of the ETP portfolio performance for 1 year and to be relatively close after 3 years, as the investment period gets longer, the performance of best actively managed fund falls rapidly below the passive portfolio