
Global equities at record highs on better growth outlook

Dave Mohr, Chief Investment Strategist at Old Mutual.

Izak Odendaal, Investment Strategist at Old Mutual Multi-Managers.
Despite widespread political uncertainty following the Brexit referendum and the US election (and ahead of key European elections), the global economy appears to be growing at the fastest rate since 2014. All the major economies are expanding, in what has been called a “synchronised upswing”. The Citigroup Economic Surprise Index (which measures how economic data performs against expectations) was hovering around the highest level for developed economies since mid-2010 in January. Deflation fears have also fallen away, as headline inflation rates in the developed world are moving towards 2% on the back of higher commodity prices. Even deflation-prone Japan saw prices increasing over the past year.
US rate hike coming soon
In the US, where the expansion is the oldest among major developed economies (starting mid-2009), the Federal Reserve (the Fed) is eyeing another rate hike “soon”. Several top Fed officials have laid the ground work for a hike in speeches and interviews over the past two weeks and the Fed’s preferred inflation measure, the personal consumption expenditure deflator, rose to 1.8% in January, close to the Fed’s 2% target. Unemployment insurance claims fell to a 40-year low, indicative of a strong labour market. The probability of an interest rate increase next week implied by futures markets jumped from 50% to 90%. This caused only a bit of a flutter, with the dollar slightly stronger and commodities weaker. However, while the timing of future hikes is uncertain, the overall path of rate increases is likely to be gradual and well signalled. The Fed does not want to shock markets or tip the economy into recession.
Global equities at record levels
In line with renewed optimism on global growth and inflation led by the US, global equities have surged to new highs. The MSCI World Index broke through its previous record high on its way to delivering returns of 2.8% in US dollars in February and 22% over the previous 12 months. Since global markets were still very weak in February 2016, one-year returns are flattered by the low base. The previous peak in the MSCI World Index was reached in May 2015. It means global markets moved sideways for the previous 18 months. The US S&P500 returned 3.9% in February on its way to a new record level. Over 12 months, the index of blue chip US stocks gained 25%. Japan’s Nikkei 225 lagged major developed market indices in local currency terms in February, but returned 21.6% over 12 months in yen. The Eurostoxx 600 Index posted a return of 3% in euros in February, lifting the one-year return to 14.8%. The index is still 10% below its 2015 peak.
Emerging market equities have benefited from the more favourable global environment and resumed capital flows. Data from China this time of year has to be treated with care due to the shifting timing of the Lunar New Year which complicates year-on-year comparisons, but it has generally been good. The outlook for other emerging markets is also better. In India, the impact of “demonetisation” appears to be smaller than feared but it is also unclear whether the removal from circulation of large denomination bank notes will deliver the promised long-term benefits. Commodity-producing emerging markets are still under pressure, but the outlook has improved significantly. Export prices and currencies have firmed, which in turn leads to lower inflation and interest rates. This is a reversal of the process that relentlessly squeezed countries like Russia, Brazil and South Africa in recent years. Brazil’s central bank cut rates by 75 basis points in February, as inflation declined to 5%. The rand appreciated 2.7% against the US dollar during February, and if it firms up further, the SA Reserve Bank will start considering rate cuts.
Emerging markets that are manufacturing exporters – including China, Korea and Taiwan – have reported improved export growth numbers. Shipping freight rates have also increased substantially. This suggests that the big slump in global trade may be easing.
The MSCI Emerging Markets Index returned 3.1% in US dollars in February, lifting the 12-month return to 29%. China, Korea, Brazil and India were the standout performers. Over 12 months, the local currency return was 22.7%, suggesting that the basket of EM currencies strengthened against the greenback over this period, adding to dollar returns. Although emerging market equities have outperformed developed markets since the start of last year, the MSCI Emerging Markets Index is still 10% below its May 2015 level and 20% below its previous peak in April 2011.
Bond market
In contrast to the buoyant equity market, the bond market seems to be more sceptical of the “reflation” trade. Long bond yields surged (bond prices fell) in developed markets after the US election, but are below recent peaks. While the US 2-year bond yield increased to 1.3% on the expectations of Fed interest hikes, longer-date US bond yields rose by less (i.e. the yield curve flattened). The benchmark US 10-year yield ended the week at 2.48%, up from 1.8% a year ago but below the recent peak of 2.6%. The German 10-year bund yields fell from a recent peak of 0.48% to 0.3% at the end of last week.
Resources weigh on local market
Local equities did not follow global markets higher in February. On the contrary, the FTSE/JSE All Share Index (ALSI) lost 3.1% during the month while the FTSE/JSE Shareholders Weighted Index (SWIX) fell 1.5%. This reduced the return for the first two months of the year to 1% for both indices. The ALSI returned 6.3% and the SWIX 7.7% over 12 months.
The Resources index slumped by 9.9% in February, wiping out January’s strong gains. Over one year, it is still the leading sector on the JSE with a 20% return. The losses stemmed from double-digit declines in the gold mining, platinum mining and general mining sectors. While the latter two sectors are still up strongly over 12 months, gold mining is down 35%. The rand price of gold ended the month at R16 434 per tonne, down from a record high of R20 546 immediately after the Brexit vote in June last year. However, neither the rand price of gold or platinum moved much during the month.
Industrials were weighed down by the stronger rand in February, losing 1.5%. Industrials are flat over 12 months. Personal goods (Richemont) lost 9% in the month, while healthcare, media (Naspers) and telecommunications also posted sizable losses.
Financials were marginally positive in February, and returned 9.4% over the previous year. After a strong rally in 2016, banks are negative in 2017, losing 4.4% in January and 0.4% in February. In contrast, the life insurance index is rebounding after lagging in 2016.
In terms of other asset classes, listed property was marginally negative in February, limiting the 12-month return to 10.4%.The All Bond Index (ALBI) returned 0.7% in February and 13.4% over the previous 12 months. The 10-year government bond yield was largely unchanged to end February at 8.8%.
Local economic data still pointing to recovery
Local economic data released last week points to a gradual improvement. Though manufacturing production contracted in the last quarter of 2016, indications are that it could rebound. After a 4.2-point rise in January, the Absa Purchasing Managers’ Index (PMI) rose further to 52.5 index points in February, the highest level since June 2016. Four of the five major subcomponents are above the 50-point neutral level. The local PMI is finally moving in the same direction as the JPMorgan Global Manufacturing PMI, which hit a 68-month high in February.
South Africa posted a R10 billion trade deficit in January, almost half the 2016 deficit. Exports increased 16% over the past year, led by a surge in the export values of iron ore and coal, while imports only grew by 2.5%.
Industry body Naamsa’s data showed that sales of new vehicles were almost unchanged in February at 48 114 units compared to a year ago, but this still represents a substantial improvement from the trough of 42 986 units (seasonally-adjusted) in July 2016.
However, one indicator that remains weak is credit growth. Total loans and advances grew by 5.9% year-on-year in January, led mostly by corporate borrowing which grew by 11.5%. Household borrowing grew by only 2.8% (adjusted for “bad bank”). Mortgage lending only grew by 5.1%.
Chart 1: Citigroup Economic Surprise Index Group of 10 developed markets
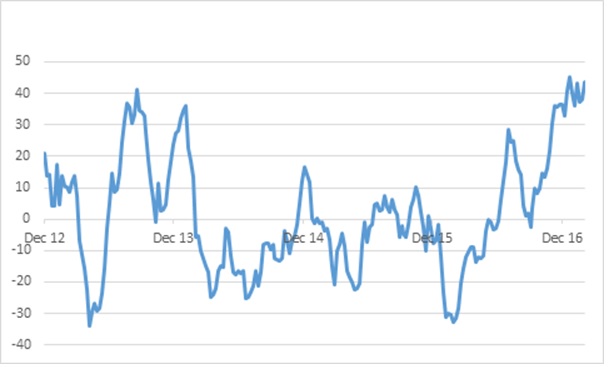
Source: Datastream
Chart 2: World and US equity indices at record levels
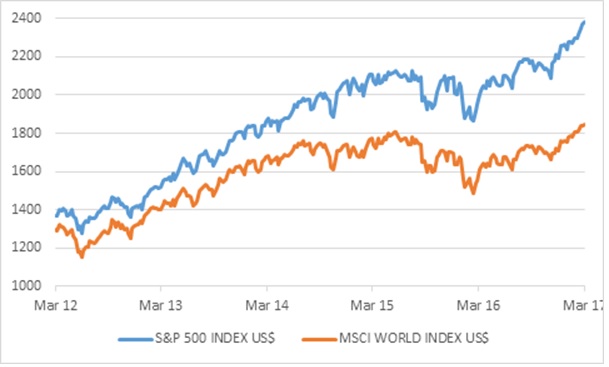
Source: Datastream
Chart 2 New vehicle sales, seasonally adjusted and smoothed
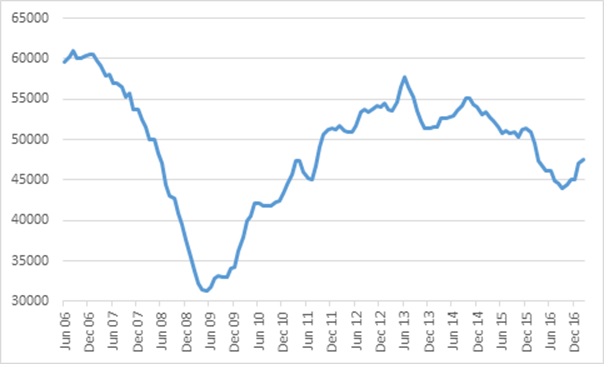
Source: Naamsa
