
Equity Benchmark consideration for risk allocators

Seeiso Matlanyane – Portfolio Manager at Prescient Investment Management
As fund managers our most immediate objective is to consistently deliver returns that are superior to a given benchmark. Our value-add or skill is commonly evaluated on realised excess returns over a specified benchmark. As such, our enhanced indexation investment processes are purposefully developed to maximise this excess return whilst carefully managing risk. The strategy is indifferent to the benchmark selected and is designed to ensure that at the very least our clients realise the selected benchmark return with a reasonable expectation for positive outperformance after fees.
The various benchmark indices that are widely available in the South African equity market can however exhibit varying risk and return characteristics. Figure 1 for instance shows that the correct benchmark selection could have meant the difference between a positive 4.70% return or a negative 0.60% return over the past year. Although we largely leave the benchmark selection to the client, given these historical performance disparities, and without getting into the technicalities behind the index construction, it is worth highlighting some high-level quantitative distinctions between the various benchmark indices vis-à-vis risk adjusted returns.
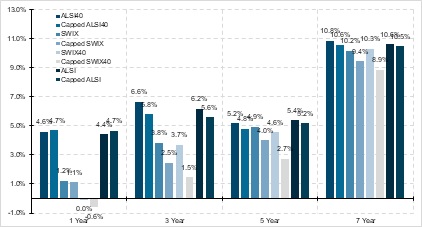
Figure 1:Periodic returns as of June 2019
Firstly, consider the return and risk (measured simply as volatility of returns) characteristics between the various indices with reference to Figure 2 below. The broader market indices (blue) have undoubtedly delivered better risk adjusted returns than their top 40 counterparts (grey). This is arguably due to the small cap premium which is more prevalent in the broader indices and suggests that clients with less conviction regarding the equity market performance are better placed with the more diversified equity market index benchmarks. It is also interesting to note from Figure 2 that the SWIX indices (red outline) have had a larger spread in returns between their capped and uncapped versions. This can principally be attributed to the rather drastic Naspers weight difference between the two versions and implies that the decision to use a capped or uncapped benchmark index is a much bigger consideration with the SWIX as opposed to the ALSI indices.
An alternative way to look at Figure 2 is to consider the Sharpe Ratio which measures the additional return over a risk-free rate (assumed 5% in this case) per unit of return volatility. If we furthermore consider only downside return volatility as risk and assume a minimum acceptable return of 8%, we can compare the indices based on their Sortino ratios. These are illustrated in Figure 3. Based on the Sortino ratio, the ALSI40 index has in fact provided better risk-adjusted returns that the broader capped SWIX index.
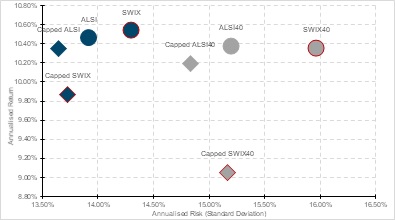
Figure 2: Annualised Risk and Return from Nov 2011 to June 2019
If we next consider risk as the maximum return drawdown, we can compare the Calmar ratios for each of the indices. The Calmar ratio perhaps gives the most transitive realised risk-adjusted returns: ALSI indices have beaten SWIX indices and broader market indices have beaten top 40 indices with virtually no distinction between capped or uncapped. This spread between ALSI and SWIX could perhaps be attributed to a higher exposure to global shares during a period where the South African rand was mostly depreciating.
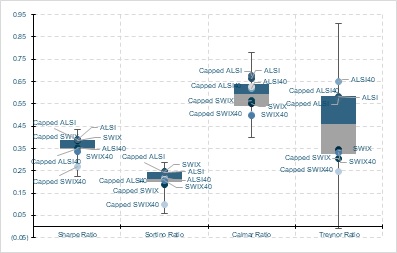
Figure 3: Various Risk Adjusted Return Measures to June 2019
Interestingly, if we finally consider sensitivity to the South African rand as risk, we can compare the Treynor Ratios for the various indices. This ratio measures the additional return over a risk-free rate (assumed 5%) per unit or sensitivity to the South African rand. Surprisingly, the ALSI indices still provided better risk-adjusted returns than the SWIX indices however with the more concentrated top 40 indices now outperforming the broader indices.
Nonetheless, each client has their own perspective of risk and their required compensation for taking risk. What is evident is that the various benchmark indices inherently have subtle and varying risk-return qualities. It is important for investors to understand these characteristics and it is our job to systematically outperform the selected benchmark after fees.

