
Trade war rumblings and the rand’s retreat

Dave Mohr, Chief Investment Strategist at Old Mutual Multi-Managers.

Izak Odendaal, Investment Strategist at Old Mutual Multi-Managers.
There’s an old saying in markets that when the US sneezes, the rest of the world catches a cold. When the US throws punches, markets can get bruised. US President Trump announced that tariffs would now be implemented against $50 billion of Chinese imports to punish China for alleged unfair trade practices. China’s predictable retaliation led to Trump calling for an additional tranche of tariffs on another $200 billion of goods. This caused renewed jitters on global equity markets, effectively nipping a promising rally in the bud.
The US imports around $500 billion in goods from China annually, and exports only around $130 billion to China. American exports to China account for less than 1% of US GDP, while Chinese exports to the US accounts for around 4% of Chinese GDP. What the trade balance numbers don’t capture is the substantial presence American multinationals have in China, with billions of dollars in sales to Chinese consumers. General Motors (GM), for instance, sells more cars in China than in the US. These cars don’t count towards US exports as they are made in China, but the revenues accrue to GM shareholders. Arguably, the bigger impact of the tariffs is not directly on trade volumes, but more the uncertainty it creates for businesses with complex value chains that span across several countries.
A further escalation of the trade dispute would be negative for the US and Chinese economies, and by implication the world economy. Therefore, it is in the interests of both countries to step back from the brink. In the US, there is a strong free trade lobby in the Republican Party with mid-term elections looming in November. While China’s government is not democratically accountable, it is also not worried about winning elections and can take a longer-term view. During the Great Depression of the 1930s, the imposition of large tit-for-tat tariff increases worsened the global slump, but then policymakers were desperately searching for a way of stimulating domestic activity. Currently, however, both these economies are humming along nicely, and neither need protective tariffs.
Rand stumbles
Predictably amid the market jitters over trade wars and the selling pressure on emerging market assets, the rand took a further beating last week. It almost touched R14 to the US dollar. The fact that it has now weakened 15% against the dollar since President Ramaphosa was sworn in is clearly not because his attempts at stabilising government and the economy are failing (it is simply too early to tell). Rather, it reflects global conditions. The rand has sold off in line with other emerging market economies amid large scale capital outflows from these markets.
Why are the rand and South African markets in general so exposed to global market developments? There are three broad reasons. Firstly, emerging markets are increasingly integrated into global markets. As Financial Times commentator John Authers put it last week, emerging markets have “developed and consolidated in many important ways since the wave of crises in the 1990s, and the disaster of 2008, but one fact remains. A large proportion of their shares and bonds, and particularly of the free float of shares, remains in the hands of foreign investors. That makes them geared to changing emotions within the developed world.” When these investors are nervous, they tend to reduce exposure to relatively risky emerging markets. South Africa with its resource dependence has always been sensitive to the global cycle, but our broader economy has increasingly integrated with the world economy since the end of isolation in the early 1990s.
Secondly, our bond and equity markets specifically have integrated into global markets. They are deep and liquid and foreigners face no restrictions buying and selling (unlike locals, who are restricted by capital controls and prudential regulation). Relative to the size of the economy, our bond and equity markets are larger than our peers. The rand is also one of the most freely traded currencies in the world. According to the Bank for International Settlements’ Triennial Survey, the rand was number 20 in terms of world forex market turnover, ahead of larger economies such as Poland, Taiwan and Indonesia. Being one of the more liquid currencies, the rand tends to be in the front of the queue when global investors sell out of emerging markets.
Current account deficit surprisingly large
The third reason is that South Africa needs foreign capital flows as it runs a large current account deficit. Again relative to the size our economy, our current account deficit is large compared to other emerging markets. New data from the SA Reserve Bank showed that the current account deficit had widened by more than expected in the first quarter, increasing from 2.9% to 4.8% of GDP.
This was largely due to the trade balance switching from surplus to deficit as the value of exports fell more than that of imports. The former was due both to lower export volumes and the stronger rand in the first quarter. The deficit on the services, income and transfer account remains the largest driver of the current account, with the trade balance being quite volatile from quarter to quarter. It was slightly smaller than in the first quarter, as dividend inflows from abroad exceeded dividend outflows during the quarter, but remains very sticky around 4.3% of GDP.
The current account balance is the broadest measures of a country’s economic engagement with the rest of the world. It tracks the net flows of imports and exports (the trade balance), the net flows of services payments, (such as cross border insurance) and tourism spending. It also tracks the net income flows (dividend and interest payments) of bonds and equities owned by foreigners in South Africa and by locals abroad. The other way to think about the current account deficit is that it reflects the shortfall of savings relative to investments. South Africans don’t generate enough savings across the household, business and government sectors to fund investment in the economy, so we need to ‘import’ savings. This happens mostly in the form of foreigners buying our bonds and equities, which as we’ve seen, they can sell in a hurry.
Inflation still surprisingly low
In other words, there are benefits to a weaker economy, but the main cost is higher inflation. The rand weakness, if sustained, should place some upward pressure on imported prices, but the overall influence of the exchange rate on inflation has diminished in recent years. May inflation was once again surprisingly low, falling to 4.4% from 4.5% in April, while the market expected an increase to 4.6%. This was despite petrol price hikes in April and May and the VAT increase, as higher fuel inflation was offset by declining food inflation. Excluding the impact of both volatile food and fuel prices, core inflation was also 4.4%. This is a truer measure of underlying price pressures in the economy, and these are clearly still subdued. In the current environment, companies are simply not in a position to push through large price increases.
What does it mean for investors?
The exchange rate should not be seen as the share price of South Africa, with a weak rand signalling domestic troubles. Investors should rather view the exchange rate as an important adjustment mechanism for the domestic economy. A weaker rand not only supports export value, but also boosts the values of South Africans’ substantial foreign asset basses. The Reserve Bank also reported that South Africa had a positive net international investment position of R562 billion in the first quarter, as the value of foreign assets exceed foreign liabilities. The economy therefore has a large built-in rand hedge. This extends to local investors, and typical diversified portfolios should on balance benefit from a weaker rand. Specifically, our funds have substantial rand hedge exposures, directly through global equities and property and indirectly through JSE-listed companies with global operations.
Chart 1: Emerging market currencies against the US dollar, indexed to 100
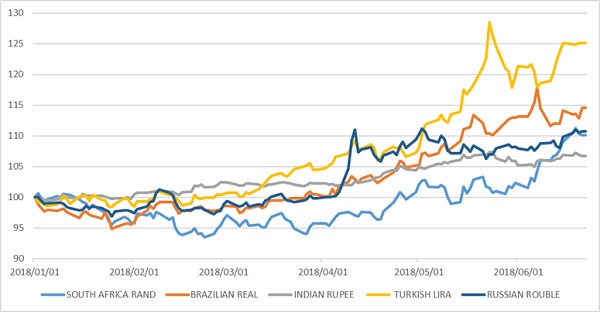
Source: Thomson Reuters Datastream
Chart 2: South Africa current account balance, % of GDP
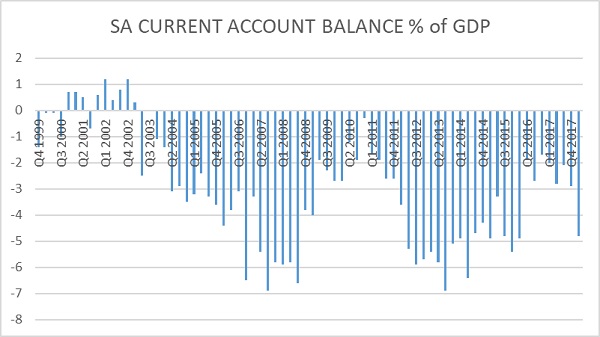
Source: SA Reserve Bank
Chart 3: South Africa net international investment position (value of foreign assets minus total foreign liabilities), R billion
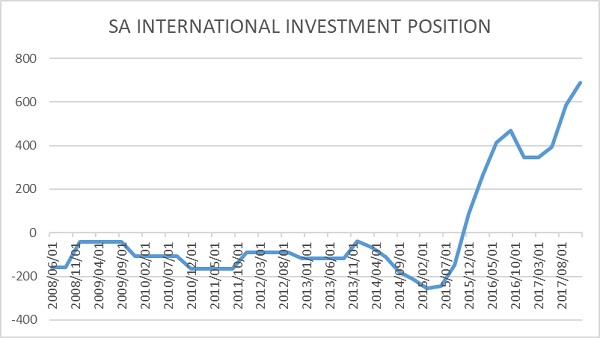
Source: SA Reserve Bank
