
Expenditure side of SA GDP reflects pressure on demand

Sanisha Packirisamy, Economist at MMI Holdings.
The South African Reserve Bank’s (SARB) Quarterly Bulletin confirmed that real GDP growth slowed to 1.6% y/y in 2Q15 from 2.0% y/y in 1Q15.
Growth in domestic demand underperforming growth in overall GDP
The expenditure breakdown of GDP also highlighted slower growth in domestic demand relative to the performance in overall economic activity (see chart 1). Over the same time period, growth in domestic demand (household consumption + government spend + fixed investment) edged higher from 1.1% y/y in 1Q15 to 1.4% in 2Q15, but remained below the growth rate in real GDP for the sixth consecutive quarter.
Chart 1: Domestic demand still growing slower than overall economic activity (% y/y)
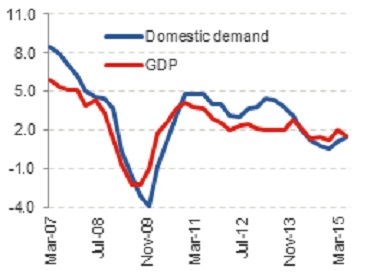
Source: Global Insight, Momentum, data up to Jun-15
Domestic demand played a minor role in supporting overall GDP growth in the second quarter of the year (see chart 2), which contracted by 1.3% in q/q seasonally adjusted annualised terms (saar) in 2Q15 following a 1.3% rise in 1Q15. Inventories plummeted in 2Q15 partly on the back of a rundown in platinum inventories in the mining sector (to fulfill offshore orders), while crude oil volumes were also reduced in line with scheduled maintenance shutdowns at some of the country’s major oil refineries. Moreover, the decline in the residual (the unexplained portion of GDP) reached its highest level on record (see chart 3), further detracting from overall GDP growth in 2Q15.
Meanwhile, developments in net exports benefited overall GDP in the second quarter of the year. Notwithstanding a further decline in international commodity prices, export volumes of platinum, gold, iron ore, chemical products and vehicles grew in 2Q15. This was accompanied by a reduced level of imports driven by lower crude oil imports and weaker growth in domestic demand.
Chart 2: Real GDP growth stack-up in 2Q15 (% q/q saar) boosted by net trade
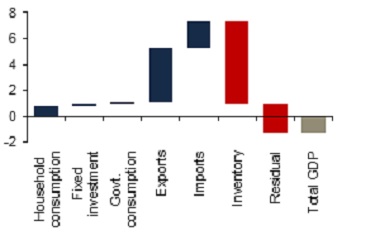
Source: Global Insight, Momentum
Chart 3: Largest negative residual captured on record since 1960
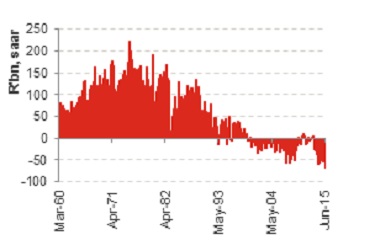
Source: Global Insight, Momentum
Households under pressure
Real expenditure by households slowed to 1.2% q/q saar in 2Q15 from 2.4% in the previous quarter as higher taxes and fading favourable fuel price gains eroded real disposable incomes. This left year-on-year growth steady at 1.6%. Growth in both discretionary and non-discretionary spend slowed over the second quarter of the year reflecting broad-based weakness. Growth in durable goods fell sharply in 2Q15 to its lowest level observed since 2Q09 largely owing to a poor performance in vehicle sales, while car parts (classified as semi-durable goods) contributed to a slowdown in the semi-durable goods category. Nevertheless, the slowdown here was somewhat countered given that the SARB reported higher spend on clothing and footwear as a result of more competitive pricing. Although growth rates in the discretionary categories (namely durables and semi-durables) rebounded between 3Q07-2Q12 and 3Q12-1Q15, the latest figures for 2Q15 show signs of renewed stress. Within non-durables, the SARB pointed out a further acceleration in food spend, while load-shedding impacted spending on electricity. Lastly, spend in the services component experienced higher outlays on rent, while transport expenditure slowed in 2Q15.
Chart 3: Weaker growth across all household spending categories (%y/y)
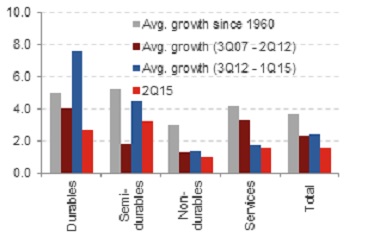
Source: SARB, Global Insight, Momentum
In our view, the macro drivers for household spend remain under significant pressure. An expected rise in inflation into 2016 is expected to curb real wage growth, while employment gains are expected to be minimal in upcoming quarters as business confidence remains at unhealthy levels. Tepid household credit growth, still-elevated debt levels (see chart 4), a rising interest rate environment and less favourable wealth conditions (thanks to recent equity market performance) bode ill for growth in household spend over the next year.
Chart 4: SA households remain relatively highly indebted, while wealth ratios ticked lower from near all-time highs
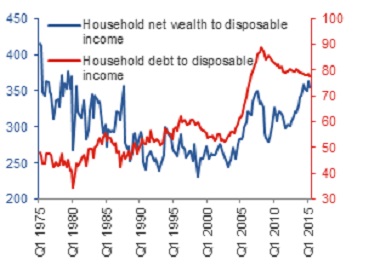
Source: SARB, Momentum, data up to 2Q15
Discouraging fixed investment performance reflective of downbeat business confidence
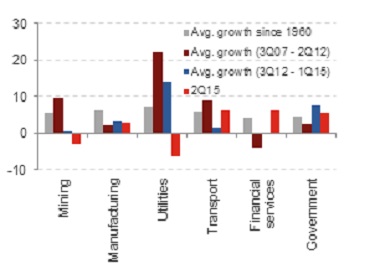
Growth in total fixed investment slowed sharply from 2.3% y/y in 3Q14 to 0.2% y/y in 2Q15, with growth outside of government infrastructure remaining soft (see chart 5). Growth in infrastructure outlays by general government remained reasonably resilient at 5.9% y/y in 2Q15, while fragile growth in state-owned enterprise (SOE) spend picked up marginally from 0.2% y/y in 1Q15 to 1.1% in 2Q15. Growth in private spend inched higher to 1.1% y/y in 2Q15 following four consecutive quarters of negative growth.
Chart 5: Government capex held up reasonably well in 2Q15 (% y/y)
Source: SARB, Global Insight, Momentum
The SARB attributed slow growth in private spend to sluggish economic growth and noted that real capital formation was weak in most private sectors aside from the continued ramp-up in renewable energy ventures supported by the Bid Window 3 projects in particular.
Although weak infrastructure spend appears to be a global phenomenon, an erosion in capital infrastructure bodes ill for SA’s growth capacity further down the line. Admittedly, SA’s total fixed investment-to-GDP ratio remained at 20.4% in 2Q15, unchanged relative to levels last seen in 2008/2009, but the share of private spend has fallen from its 15.4% peak in late 2008 to c.13% in 2Q15 (see chart 6).
Chart 6: Total fixed investment-to-GDP ratio unchanged (%)
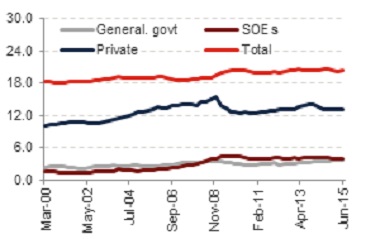
Source: SARB, Global Insight, Momentum
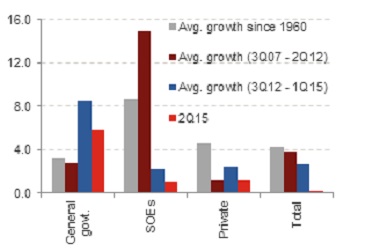
Fixed investment can also be classified by type of economic activity. On this basis, it is clear how economic policy uncertainty, electricity constraints and weak demand have tainted fixed investment growth in areas such as mining and manufacturing (see chart 7).
Chart 7: Paltry growth in mining investment since 3Q12 (% y/y)
Source: SARB, Global Insight, Momentum
Lower corporate savings and still-weak household savings, but some improvement in government dissaving
SA’s national savings relative to GDP dipped from 16.4% in 1Q15 to 16.0% in 2Q15 largely due to a decrease in savings by the corporate sector, which offset a decrease in dissavings by general government. Lower corporate savings corroborates the decline in growth in corporate profitability observed in Stats SA’s gross operating surplus figures for 2Q15 as well as the SARB’s data on robust growth in corporate lending. The household savings-to-GDP ratio continued to track sideways over 2Q15, averaging -1.5% over the past four quarters (see chart 8).
Chart 8: Lower corporate savings offsets improvement in government dissaving
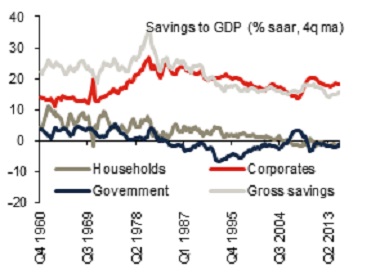
Source: SARB, Global Insight, Momentum, data up to 2Q15
Current account dynamics improve in 2Q15
A robust export performance and slowing imports led to SA posting its first trade surplus in three and a half years in 2Q15. Exports climbed by 13.9% y/y in volume terms during the second quarter of the year, up from 5.6% y/y in 1Q15 owing to higher mining, chemical and vehicle (mainly to the US, Germany and Belgium) exports, while import growth increased by 7.1% y/y from 4.8% a quarter ago. In quarter-on-quarter terms import volumes edged down on lower oil imports and softer domestic demand. SA’s trade balance swung from a deficit of R68 billion (-1.7% of GDP) in 1Q15 to a surplus of R13.7 billion (0.3% of GDP) in 2Q15 (see chart 9).
Chart 9: Trade surplus leads to narrowing in current account deficit
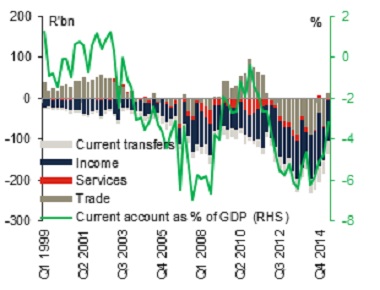
Source: SARB, Global Insight, Momentum
Although SA’s terms of trade improved slightly in 2Q15 (as the rand price of exports accelerated above that of imports), the terms of trade proxy (developed by Deutsche Bank) suggests a sideways movement over 3Q15 (see chart 10). The proxy is based on exported platinum and gold prices as well as imported oil prices.
Chart 10: Terms of trade proxy points to little improvement in 3Q15 (index values)
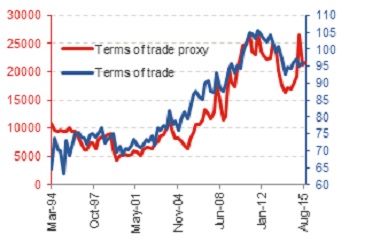
Source: SARB, Global Insight, INET BFA, Momentum
A further deterioration was noted in the net services account which declined to a larger deficit of R7.2 billion in 2Q15. According to the SARB, the rate of increase in travel receipts in 1H15 slowed markedly (c.-9%) in comparison to 1H14. The SARB warns that new unfavourable legislation could dampen tourism-related receipts further and could lead to an additional widening in the deficit on the services, income and transfer account.
Balance on financial account narrows on account of net other investment and unrecorded transactions
The balance on the financial account narrowed substantially in 2Q15 (see chart 11), owing to a net outflow of R39.3 billion in the other investments category (including the withdrawal of non-resident deposits) and a R15.6 billion contraction in unrecorded transactions. Net foreign direct investment recorded at a trivial R0.2 billion, while net foreign portfolio inflows increased meaningfully by R44.8 billion or 4.5% of GDP over the corresponding time period.
Chart 11: Net foreign portfolio inflows were the largest contributor to the financial account in 2Q15 (R’bn)
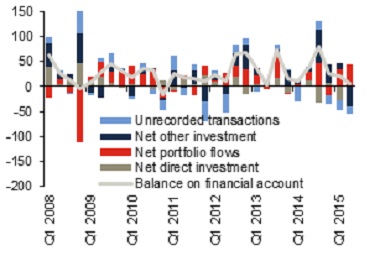
Source: SARB, Global Insight, INET BFA, Momentum
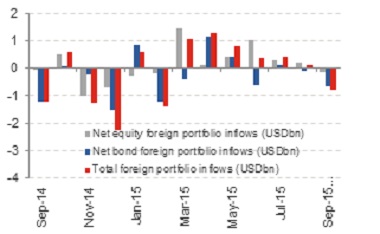
Recent market turmoil induced by Chinese growth and equity market fears have consequently led to net foreign portfolio outflows in both bonds and equities (see chart 12) suggesting that the funding mix might be more reliant on net other investment in 3Q15, when the current account is expected to widen marginally.
Chart 12: Net foreign portfolio outflows observed in bonds and equities during first two weeks of September 2015
Source: SARB, Global Insight, INET BFA, Momentum
No changes to weak SA growth view
The SARB’s expenditure side breakdown of GDP confirms soft momentum in domestic demand. Mounting consumer headwinds are expected to keep growth in household consumption expenditure at an average of 1.5% between this year and next. Furthermore, electricity constraints, muted business confidence, soft demand and ongoing economic policy uncertainty will likely keep a lid on investment growth at least until 2017 when further electricity generation capacity is expected to come onstream, alleviating energy constraints. Although the current account deficit narrowed by more than expected in 2Q15, little improvement in the terms of trade proxy for 3Q15 and still-weak global trade activity suggest that export growth could come under pressure, seeing a slight widening in the current account for the remainder of the year.
