
Economic and market snapshot for May 2016

Sanisha Packirisamy, Economist at MMI Holdings.

Herman van Papendorp, Head of Asset Allocation at Momentum.
Global economic developments.
United States (US)
Expectations for an earlier interest rate hike are revived on perceived hawkish Federal Reserve (Fed) meeting minutes
The Wall Street Journal’s Survey of Economists revealed a 20% chance of the US economy falling into a new recession within the next twelve-month period, following a paltry 0.5% (upwardly revised to 0.8%) quarterly growth print (seasonally adjusted and annualized) in 1Q16. However, data over the past seven years exposes a consistent pattern of weaker first quarter growth, followed by a sharper acceleration in economic activity in the second quarter of the year (see chart 1).
Chart 1: Firmer US growth print expected in 2Q16
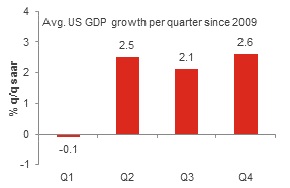
Source: Bloomberg, Momentum Investments
This phenomenon has partly been attributed to poor weather conditions in recent years and residual seasonality unaccounted for, particularly in the business investment and government-related categories.
Forward-looking surveys point to a recovery in growth in the second quarter of the year. The US ISM Services Index leapt higher to 55.7 index points in the latest reading for April, indicating renewed strength in the services sector. In addition, solid growth in retail sales (+3.0% y/y in April 2016) is likely to be supported in upcoming quarters by underlying strength in the US housing and labour markets, positive wealth gains and above-average consumer confidence levels.
Moreover, a c.3.0% year-to-date weakening in the US dollar basket and modest growth in the Eurozone may alleviate the extent of the drag from net exports on US GDP growth.
Inflation is likely to head towards the Fed’s target of 2% in upcoming quarters in response to strengthening economic data and a tighter labour market, suggesting that the Fed is likely to raise rates before the year is up.
The implied probability for a June 2016 interest rate increase of 25 basis points based on Fed funds futures rose from a low of 2% in mid-February to 34% in the week following the release of the minutes of the April 2016 Federal Open Market Committee (FOMC) meeting. Policymakers had sounded notably hawkish, noting that “A couple of participants were concerned that further postponement of action to raise the federal funds rate might confuse the public about the economic considerations that influence the Committee’s policy decisions and potentially erode the Committee’s credibility.”
Eurozone
Economic headwinds likely to slow pace of growth
The Eurozone’s modest economic recovery continued into the first quarter of the year, helped by easy monetary policy provided by the European Central Bank (ECB) and slightly stimulative fiscal conditions. The 1.5% y/y growth rate (see chart 2) was underpinned by higher GDP growth in the region’s largest economy, Germany, which saw a notable acceleration in fixed investment.
Chart 2: Eurozone growth momentum set to slow
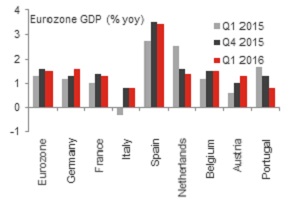
Source: Bloomberg, Momentum Investments
Though overall real GDP has finally risen to levels last seen in 1Q08, growth activity remains disparate across the underlying economies. Germany’s real GDP level is currently 5.5% higher than where it was in 1Q08, followed by the French economy which is 3.5% larger than it was in the first quarter of 2008. Meanwhile, the Italian and Spanish economies are 8.5% and 4.0% smaller in real terms than they were in 1Q08.
Forward-looking indicators, including the Eurozone Composite Purchasing Managers’ Index (PMI), signal a softer growth outlook for the second quarter of the year. The composite PMI reading fell to a 16-month low, largely on the back of a decline in manufacturing conditions, while services sentiment tracked sideways in April 2016.
Accommodative fiscal and monetary policy will likely persist well into 2017 to boost both growth and inflation outcomes. The European Commission recently opted not to fine Spain and Portugal for running large fiscal deficits, which acts as yet another indication that austerity has been postponed.
Japan
Still experiencing sub-par growth and near deflation
Despite cutting interest rates into negative territory in late-January, inflation pressures remain dormant, with the headline measure falling well below the Bank of Japan’s (BoJ) target. The 10.5% strengthening in the yen against the US dollar over the past twelve months (more recently owing to a flight to safety following global financial turbulence) does not only suggest that inflation will remain quiescent over upcoming months, but it also threatens the outlook for exports.
Lethargic growth in global demand and the lingering effects of two severe earthquakes in Japan’s manufacturing hub for automotive parts and semiconductors have further disrupted manufacturing supply chains. The Nikkei Flash Japan Manufacturing PMI fell from 48.2 index points in April to 47.6 points in May (see chart 3), its lowest reading since late 2012. The sub-indices suggest that exports are being hit hard by yen strength, while new sales orders point to a more persistent downturn in industrial activity.
Chart 3: Japan’s industrial sector in the doldrums
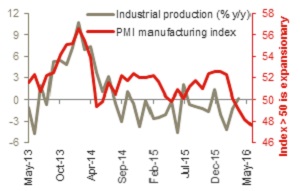
Source: Bloomberg, Momentum Investments
In support of reviving tepid inflation and growth activity, Prime Minister Abe intends to delay the planned sales tax increase for two and a half years (until October 2019). Moreover, with the finance minister recently being instructed to frontload spending for the new fiscal year, it appears as though there is appetite to expand on the so-called second arrow of Abenomics (economic policies based on 1) monetary easing, 2) fiscal stimulus and 3) structural reform). Nevertheless, market-opening reforms, forming part of Prime Minister Abe’s third arrow, are still in our opinion necessary to encourage faster growth activity.
Emerging markets (EM)
Growth performance across net commodity exporters improving off a low base
Weak commodity prices, subdued global trade activity and the possibility of higher US interest rates have been behind significant downgrades to EM real GDP growth forecasts over the past year. The Bloomberg median forecast for 2016’s growth outcome has been pared back to 4.3%, from 5.1% a year ago and 4.6% at the start of the year.
The pace of growth downgrades has nonetheless slowed and could bottom out soon. Capital Economics’ EM GDP tracker points to a marginal acceleration in growth to 3.2% y/y in March 2016. The uptick can be attributed to an increase in growth in net commodity exporters to 1.1% y/y in March, while growth across net commodity importers held steady at 4.5% y/y (see chart 4).
The turnaround in growth in net commodity exporting nations appears to be relatively broad based. Retail sales have stopped falling across net commodity exporting nations, while the rate of contraction in export growth in this region has slowed since the start of the year.
Chart 4: Net commodity exporters growing off a low base
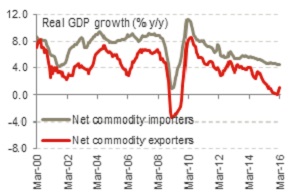
Source: Bloomberg, Momentum Investments
Even so, an imminent slowdown in China’s industrial-led sectors of the economy and the potential for interest rate increases in the US economy are expected to temper the pace of the EM growth recovery.
Local economic developments
Revisions leave GDP little changed at the headline level
Up until recently, Stats SA released the production-side GDP data, while the SA Reserve Bank (SARB) was responsible for the expenditure-side GDP data. To conform with international best practice, Stats SA will now be in exclusive charge of compiling the alternative breakdowns of quarterly GDP.
The new methodologies applied have led to the near-elimination of the residual (unaccounted-for share of GDP) which has been escalating as a share of real GDP growth since the global financial crisis (averaging a negative R26.8 billion over that period in the previous data series), which will bring closer alignment between the production and expenditure-side GDP estimates.
The revisions have left real GDP growth 0.2% (and nominal GDP around 0.1%) higher between 2010 and 2015. Growth in household consumption expenditure (HCE) has been revised slightly lower to 2.9% over the corresponding period, while growth in both government consumption expenditure (GCE) and gross fixed capital formation (GFCF) have been revised upwards by 0.2%. Growth in exports saw the largest downward revision to 3.8% while growth in imports experienced the largest upward revision to 6.1% over the same time period (see chart 5).
Chart 5: Minor revisions to weak domestic demand
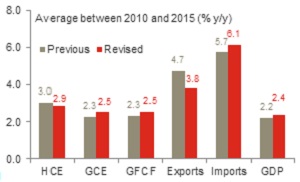
Source: Stats SA, Momentum Investments
The relatively small change to nominal GDP figures suggests a minimal change to the past five-year average budget (-4.7% of GDP) and current account (-4.5% of GDP) balances.
According to Citi Research, growth in real GDP per capita has been revised slightly higher from a five-year average of 0.7% to 0.8%. The trend in average living standards, however, remains negative and as such the GDP revisions are likely to do little to influence S&P’s decision on SA’s sovereign rating.
Financial market performance
Global markets
World equity markets ended the month relatively flat (+0.1%), with the outperformance across developed markets largely being offset by losses across emerging markets.
Within the developed market composite, gains were strongest in the Eurostoxx 50 Index (+2.9%) and the Nikkei 225 Index (+3.4%). Steady gains in the Eurostoxx 50 Index were buoyed by German, French and UK bourses on the back of surprisingly firm economic data in the first quarter of the year and an increase in confidence stemming from another Greek debt deal, while the Nikkei 225 Index was buffered in late May by news of a potential delay in the Japanese sales tax.
Meanwhile, the MSCI Emerging Markets Index lost 4.0% in May. Emerging markets are likely discounting the possibility of further capital outflows in response to potentially higher interest rates in the US. Losses were most pronounced in the MSCI Emerging Markets Latin America Index (-10.8%) and the MSCI Emerging Markets Europe, Middle East and Africa (EMEA) Index (-7.9%), while losses were capped at 1.2% in the MSCI Emerging Markets Asia Index.
Local markets
Local equities tracked global markets higher in May 2016. The FTSE/JSE ALSI gained 1.8% in May, supported by strong gains in the FTSE/JSE Industrials Index (+5.1%), while resource and financial stocks had a weaker month. A firmer US dollar and a drop in precious commodity prices left the FTSE/JSE Resources Index 3.8% lower by month end, while the FTSE/JSE Financials Index declined marginally by 2.0%.
Chart 6: Local asset class returns
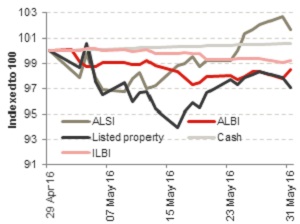
Source: Bloomberg, Momentum Investments
Both small- and mid-caps underperformed in May. The FTSE/JSE Mid-cap Index ended May 5.7% lower, while the FTSE/JSE Small-caps Index lost 3.6%.
The ALBI lost ground over May (-1.5%) as the SA ten-year bond yield sold off by 42 basis points. Listed property performance took a step back, dipping by 6.6% into mid-month, but gains in the second half of the month left the index only 3.5% lower by month end. Inflation-linked bonds gave up 0.8% over the same time period, while SA cash continued to deliver a steady 0.6% return over the month following the SARB’s decision to leave interest rates on hold at 7.0% at their May interest rate-setting meeting.
Emerging market currencies have come under renewed pressure on the back of the repricing of Fed rate hike expectations. Though the MSCI Emerging Market Currency Index weakened by c.2.5% since the beginning of the month, the rand has fared worse (losing 9.5% against the US dollar and 6.8% against the euro), highlighting lingering SA-specific risks.
