
Economic and market snapshot for December 2015

Sanisha Packirisamy, Economist at MMI Holdings.

Herman van Papendorp, Head of macro research at MMI Holdings.
Global economic developments.
United States (US)
Expect cautious approach to pace of subsequent rate hikes as US Federal Reserve balances conflicting indicators
In a widely-anticipated move the US Federal Reserve (Fed) lifted interest rates for the first time in nearly a decade from a range of 0–0.25% to 0.25-0.5%.
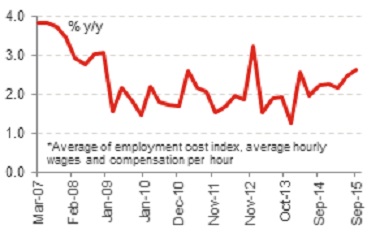
The previous interest rate hiking cycle, which ended in mid-2006, involved 17 rate increases to a peak of 5.25% in a bid to ward off inflation in a firmer growth environment. This time around, however, the Fed faces conflicting signs of firm economic growth prospects (including a tightening labour market and continued strength in the housing market) and disappointingly-low inflation. As such, we expect the pace in subsequent rate hikes to remain dependent on continued progress in the US labour market, a sustainable rise in inflation and healthier levels of global demand.
Chart 1: Tighter labour market to drive up wage inflation
Source: Bloomberg, Momentum Investments
The dovish statement that accompanied the decision to hike interest rates emphasised the importance of upcoming inflation readings and continued concerns over financial and international developments. While the Fed’s December 2015 economic projections with regards to GDP and unemployment improved marginally, there was a slight deterioration in their short-term inflation estimates. The Federal Open Market Committee (FOMC) expects that “economic conditions will evolve in a manner that will warrant only gradual increases in the federal funds rate” and further stated that “the federal funds rate is likely to remain, for some time, below levels that are expected to prevail in the longer run”.
Eurozone
European Central Bank (ECB) underwhelms market with weaker-than-expected stimulus
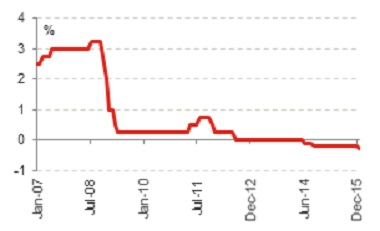
While the ECB did expand its bond-purchasing programme, it was not to the extent that most investors had been hoping for. The ECB extended its monthly purchases beyond the original September 2016 timeframe to March 2017, leaving the door open for a further potential extension. Though the amount of asset purchases remained unchanged at €60 billion per month, the ECB stated that they will reinvest principal repayments from its asset purchases as they mature and extend the scope of eligible purchases to regional local government debt. Morgan Stanley estimates that the six-month extension equates to 3.5% of GDP (€360 billion). The ECB also cut their deposit rate (the rate charged for money held at the ECB overnight) to -0.3%, compared with -0.2% previously, in an effort to encourage private banks to lend funds to companies and households (see chart 2).
Chart 2: ECB cuts deposit rate to -0.3%
Source: Bloomberg, Momentum Investments
These moves disappointed the market, which had been anticipating more aggressive action by the ECB, particularly given the marginal downgrades to already-fragile growth and inflation forecasts. The bank now expects headline inflation to average 1.0% (previously 1.1%) in 2016 and real GDP to expand by 1.6% in 2016 from 1.7% previously, even after including the impact of the additional stimulus measures.
Japan
Modest expansion to current stimulus programme
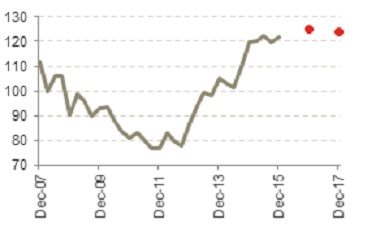
Following on from three years of Abenomics, investors were increasingly giving up on the prospect for additional easing as they expected officials to progressively shift their focus away from monetary easing towards addressing structural growth issues. Nevertheless, the Bank of Japan (BoJ) has come under pressure to ease policy further on the back of China’s growth concerns and subdued household spend which continued to weigh negatively on growth in overall economic activity. Furthermore, current USDJPY forecasts (see chart 3) remain inconsistent with Japanese reflation targets even though the BoJ has extended their 2% inflation target to March 2017 (from September 2016) in the wake of low oil prices.
Chart 3: USDJPY forecasts inconsistent with CPI target
Source: Bloomberg, Momentum Investments
After hopes of further easing were dashed at the October meeting, the BoJ surprised the market with a modest extension to their current stimulus programme. Only one out of the 42 analysts surveyed by Bloomberg had anticipated any action by the BoJ at the December meeting.
The BoJ has decided to buy government bonds with a longer maturity of 7-12 years compared to the current 7-10 years in an effort to drive down longer-term interest rates akin to the US Federal Reserve’s Operation Twist in 2011.
To encourage investment in physical and financial capital, the BoJ has further committed to buying ¥300 billion a year in shares issued by firms whose operations align with that strategy.
Emerging markets (EM)
Pockets of vulnerability within EM in countries with large external requirements or hefty dollar debt burdens
An initial strengthening in EM currencies against the US dollar in reaction to the first Fed rate hike in nearly a decade suggested the onset of US interest rate tightening had been well signalled and was to a large extent already priced into markets.
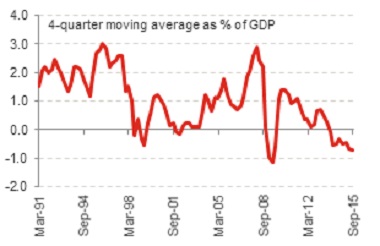
That being said, countries with large external requirements and those with significant dollar debt burdens remain vulnerable to the US Fed rate hiking cycle. Capital flows to emerging economies have contracted as a share of GDP more recently (see chart 4). Any faster-than-anticipated increase in US short rates could spur a broader retreat in flows to EMs.
Chart 4: Sharp slowdown in capital flows to EM ex-China
Source: Capital Economics, Momentum Investments
In the past, developing countries benefited from higher US rates which accompanied stronger growth activity and rising inflation. This time around, however, EMs face the headwinds of sluggish global trade and benign commodity prices given less commodity-intensive Chinese growth prospects.
Moreover, higher US borrowing costs pose a risk to growth and default rates in developing economies as EM corporates with a large exposure to dollar-denominated debt are forced to pay more to service their debts.
Local economic developments
Escalation in political and ratings risk drives rand weaker
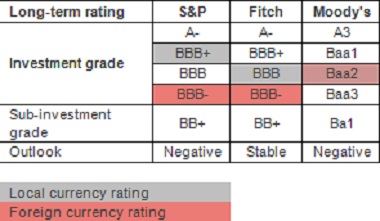
Fitch ratings agency downgraded South Africa’s long-term sovereign debt rating to BBB- from BBB, but revised the outlook from a negative stance to stable, indicating a lower likelihood of an imminent downgrade to non-investment grade status. Meanwhile, S&P ratings agency held off from downgrading SA’s long-term sovereign debt rating, but changed their outlook from stable to negative (see chart 5).
Chart 5: SA on the cusp of non-investment grade
Source: Stats SA, Global Insight, Momentum Investments
Both rating agencies alluded to the likelihood of lower potential growth going forward, particularly as a lack of policy implementation to address SA’s structural problems continues to inhibit higher trend growth in a muted commodity price environment. In addition, Fitch highlighted the extent to which policy uncertainty and investor-unfriendly proposals have weakened business confidence.
Following market-moving cabinet announcements, Moody’s dropped their outlook to negative from stable, but maintained their foreign currency debt rating at one notch higher than S&P and Fitch at Baa2. They cited growth concerns and the rising risk of fiscal slippage as the main reasons underlying their decision to downgrade their outlook to negative.
Although the appointment of Mr Gordhan as finance minister, following the controversial decision to replace the widely-respected Nene with relatively unknown Van Rooyen, should see some stabilisation in investor sentiment and market prices, local and global investors will continue to question government’s process of decision making, which has created further ambiguity around economic policy in an already-fragile growth environment.
Moreover, a more benign structural growth outlook leaves SA’s fiscal authorities with less room to manoeuver, suggesting a significant threat to Treasury’s fiscal consolidation timeline and medium-term debt stabilisation plan. Reneging on government’s expenditure ceiling remains a trigger for further negative ratings action as this would extend fiscal consolidation timelines and prevent a stabilisation in the debt ratio.
Financial market performance
Global markets
World stock markets moved lower over December on the back of renewed global growth fears after oil prices retraced further. Global commodity prices in general fell by 3.1% in December on weak demand and an overhang in global supply.
The MSCI World Index declined by 1.8% over the month, driven by a sharp 6.7% drop in the Eurostoxx 50 and a 3.5% decline in the Nikkei 225 indices as stimulus measures announced in December disappointed market expectations for more aggressive action to tackle the problem of low inflation and frail growth prospects.
Weaker commodity prices and global growth concerns saw the MSCI Emerging Markets Index dropping by 2.2% over December. Within EM, the MSCI Emerging Markets EMEA Index posted the worst performance, down 7.2% over the month. The MSCI Latin America Index lost 4.3% over December while the MSCI Emerging Markets Asia Index fared better, declining by a lesser 0.7% over the corresponding period.
Despite another dip in commodity prices and central bank action by the Fed, ECB and BoJ, the VIX volatility index nudged higher by only 2.1 index points in December.
Local markets
The South African equity market (FTSE/JSE ALSI) plunged by over 6.5% during the first half of December on the back of negative domestic news flow, including damaging cabinet reshuffles and negative sentiment expressed by the major ratings agencies (see chart 6). For the month as a whole, the index moved only 1.7% lower after staging a recovery in the second half of the month.
Chart 6: Local asset class returns
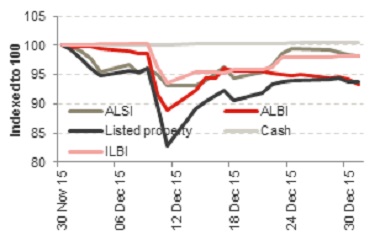
Source: Bloomberg, INET BFA, Momentum Investments
The FTSE/JSE Financials and Resources indices bore the brunt, plummeting by 6.4% and 3.9% in December, respectively, while losses in the FTSE/JSE Industrials Index were capped at 0.3% as rand-sensitive stocks benefited from a weaker domestic currency.
The FTSE/JSE Mid-cap Index declined by 4.2% over December, while the FTSE/JSE Small-caps index tumbled by a whopping 8.9% over the same time period. The ALBI lost 6.7% (SA ten-year yields sold off in excess of 115 basis points), while losses in listed property exceeded 6% in December. Inflation-linked bonds lost 1.8% in December, leaving SA cash as the outperforming asset class, ending the month 0.5% higher.
Idiosyncratic political and sovereign downgrade risks left the South African rand 6.7% weaker against the US dollar and 9.4% weaker against the euro in December.
