
Tough road ahead for SA consumers implies weak GDP performance

Sanisha Packirisamy, Economist at MMI Holdings.

Herman van Papendorp, Head of Asset Allocation at Momentum.
The National Development Plan outlines the need to shift South Africa’s (SA) growth trajectory from one led by consumption to higher levels of fixed investment and exports.
Higher levels of investment (supported by reliable public infrastructure and skills) are needed to propel living standards and reduce inequality. However, conditions for higher fixed investment remain unfavourable. Falling corporate profitability, muted domestic demand prospects and continued uncertainty around the direction of economic policy in SA has led to sluggish growth in private fixed investment, leaving overall economic activity dependent on household consumption spend (see chart 1).
Chart 1: Rising share of consumption in the economy at the expense of investment (% of GDP)
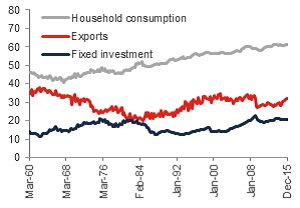
Source: Global Insight, Momentum Investments
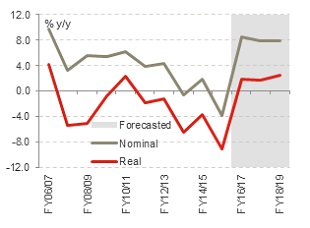
Chart 2: Oversized public sector and generous civil servant wage deals
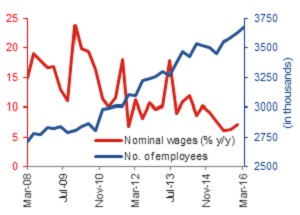
Source: INET BFA, Global Insight, Momentum Investments
National Treasury has further attributed SA’s vulnerability to shifts in global investor sentiment to the high level of consumption by government and households as a share of overall economic activity. Consumption-driven imports have furthered SA’s external imbalances leaving the country heavily reliant on foreign savings. Growth in household consumption has averaged 3.6% over the long term (using data from 1960), exceeding overall GDP growth which averaged 3.0% p.a. over the corresponding period. Economic and financial market uncertainty following the global financial crisis led growth in household consumption expenditure lower to an average of 2.1% p.a., only marginally higher than the 1.9% average growth rate recorded in overall economic activity over the same time period.
Generous public sector wage deals and the size of the public sector (see chart 2) have contributed to the rise in consumption at the expense of investment. The public sector now accounts for 23.5% of employment in SA (3.7 million workers), up from 18.8% (2.7 million workers) in the first quarter of 2008. With fiscal constraints mounting, the ramp up in public sector employment and growth in civil servant wages are expected to slow, negatively impacting the cyclical growth performance of overall household consumption.
Non-essential spend likely to come under pressure
The share of discretionary spend (including cars, furniture and clothing) increased dramatically since early 2000, coinciding with SA’s terms-of-trade boom and rampant credit growth. However, a weak economic setting has now eroded consumer confidence. Consumer surveys indicate that consumers are likely to scale back their discretionary purchases on luxury or non-essential items in upcoming months (see chart 3) despite a relatively muted currency pass-through to date (refer to chart 10 further on in the report).
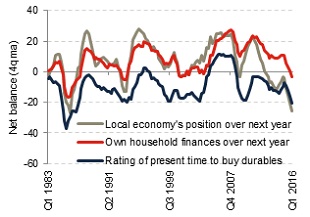
Chart 3: Discretionary goods spend looking vulnerable
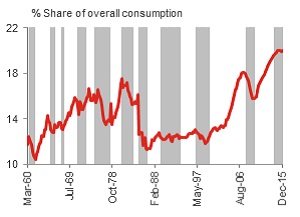
Source: Global Insight, SARB, Momentum Investments, shaded areas = economic downturns as classified by the SARB
Broad-based consumer pessimism
The FNB/BER (Bureau of Economic Research) Consumer Confidence Index has slumped to -10.5 index points on average for the past four quarters, relative to its long-term average of 1.5 index points since 1982 and 4.1 points since 1994. Consumers appear to be struggling across the board, with high- (earning more than R14 000 per month), middle- and low-income earners’ confidence levels all trending in negative territory (see chart 4).
Although consumers’ view on their own personal finances over the next year are less pessimistic than their outlook on the local economy (the latter reaching lows last seen in mid-1986), on a four-quarter moving basis both of these sub-indices are now in negative territory. Moreover, consumers view the current time as inappropriate to purchase durable goods, corroborating our view on discretionary goods spend likely remaining under pressure in coming months (see chart 5).
Chart 4: Consumers negatively affected across the board
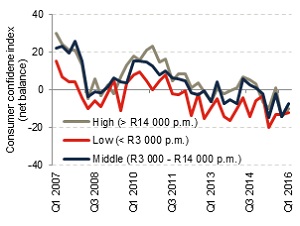
Source: BER, Momentum Investments
Source: BER, Momentum Investments
Shift in spending composition
Rising GDP per capita has likely fuelled the import-intensive nature of consumer spending over time. The increase in access to credit, an upward shift in living standards between 2000 and 2011 and more affordable technological goods further shaped expenditure patterns with the share of household furniture, clothing spend, personal care items and communication spend increasing relative to non-discretionary outlays (see chart 6, 7, 8 and 9).
Chart 6: Consumers spending more on gadgets and furniture and less on cars (durable goods split)
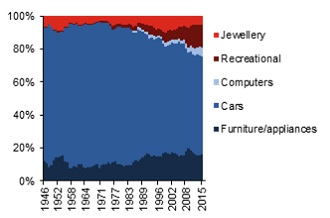
Source: Global Insight, Momentum Investments
Chart 7: Consumers spending more on clothing (semi-durable goods split)
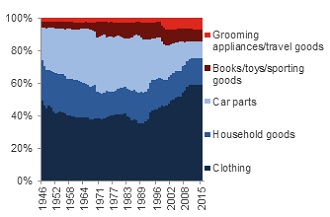
Source: Global Insight, Momentum Investments
Chart 8: Consumers spending more on fuel and electricity and less on food (non-durable goods split)
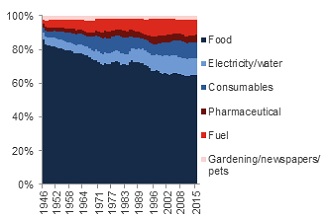
Source: Global Insight, Momentum Investments
Chart 9: Consumers spending more on transport and phone bills and less on rent (services split)
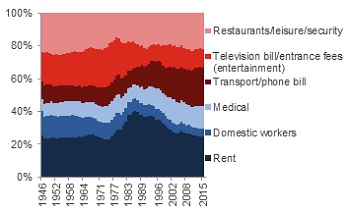
Source: Global Insight, Momentum Investments
Low-income households hit by rising food inflation, sluggish jobs growth and tighter access to credit
The lowest annual rainfall levels since records began in SA in 1904 and past rand depreciation (18% weaker on a trade-weighted basis relative to a year ago) have pushed food inflation higher to 9.8% y/y in March (see chart 10). The lagged impact on meat prices (as farmers rebuild herds) suggests food inflation is likely to increase further in upcoming months. Rising food prices are likely to have the heaviest impact on the poorest citizens of SA. Very low-income earners (earning less than R21 300 per year using Stats SA’s definition) spend over 35% of their consumption basket on food items, while very high-income earners (earning above R142 200 per year) spend less than 10% on food (see chart 11).
Chart 10: Food inflation on the rise
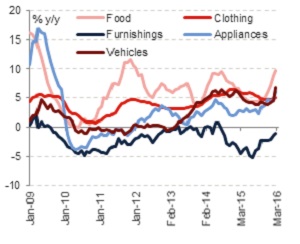
Source: Global Insight, Momentum Investments
Chart 11: Low-income highly exposed to food inflation
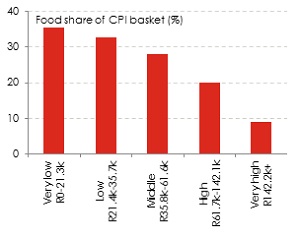
Source: BER, Momentum Investments
On a more positive note, current weather predictions are forecasting a 90% chance of average (neutral) or above-average (La Nina) rainfall (see chart 12) in SA, implying that food prices are likely to fall sharply in 2017, providing some inflation relief and real wage growth support to consumers next year.
Chart 12: High probability of normal (neutral) or above normal (La Nina) rainfall by year end
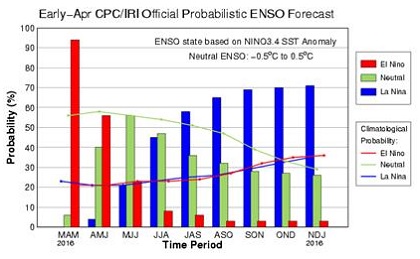
Source: International Research Institute for Climate and Society (Columbia University)
Moreover, Treasury have preserved the real value of social grants currently received by 16.9 million social grant beneficiaries. The February 2016 budget pointed to a positive increase in social grants in real terms over the medium-term framework (see chart 13), partly alleviating high food inflation concerns this year.
Fiscal policy in SA remains progressive and aims to reduce inequality via well-targeted government grants and through raising non-regressive taxes. The World Bank has shown that 70% of the outlays on social grants and 54% of spending on education and health go the poorest half of the population in SA. The World Bank report further states “before taxes and social spending the income of the richest 10% of South African consumers is more than 1000 times bigger than the poorest 10%. After taxes and social spending, this gap falls so that the income of the richest 10% becomes 66 times bigger than the poorest 10%. This corresponds to a reduction in the Gini coefficient on income from 0.77, before taxes and social spending, to 0.59 after the impact of fiscal interventions.”
Chart 13: Real growth in social grants to be maintained
Source: National Treasury, Momentum Investments
The threat of further job losses poses an additional risk to low-income earners in addition to a rising inflation profile detracting from real growth in disposable income. Stats SA recently reported an increase in the headline rate of unemployment to its highest level on record (revised survey began in 2008) at 26.7% in 1Q16 (see chart 14). The unemployment rate rose above 38% on the expanded measure, taking account of discouraged workers (those who have given up looking for employment for a period longer than four weeks). While unskilled (elementary and domestic workers) and semi-skilled (clerks, sales assistants, skilled agriculture, craft/trade and machinery operators) workers lost a larger proportion of jobs following the financial crisis, growth in these jobs rose at a faster pace since the trough in employment in 3Q10 relative to the 11% increase in skilled jobs (managers, technicians and professionals) over the same time period (see chart 15). Nevertheless, we expect momentum in unskilled and semi-skilled employment to slow, given ongoing economic headwinds and sticky wage settlements forcing companies in the mining and manufacturing sectors in particular to reduce headcount in an effort to contain their overall wage bills.
Chart 14: Unemployment rate reaches new high
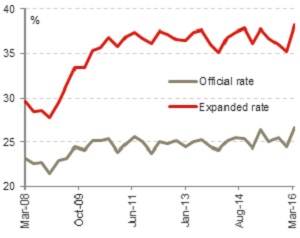
Global Insight, Momentum Investments
Chart 15: Momentum in unskilled hires likely to slow
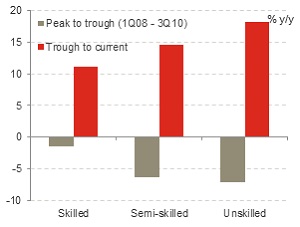
Source: Global Insight, Momentum Investments
Households are still relatively indebted
Too much debt is a key reason behind consumer vulnerability remaining elevated. The MMI UNISA Consumer Vulnerability Index rose to a less vulnerable reading of 50.9 index points in the final quarter of 2015 from 46 points in 3Q15, but remained in “mildly exposed” territory implying that cash flows are affected to the extent that there exists a high risk of becoming financially vulnerable or insecure. The underlying indices pointed to consumers feeling “mildly exposed” towards their income, expenditure and savings, while remaining “very exposed” towards their debt-servicing capability.
Household debt peaked as a share of disposable income in 1Q08 at 88.8% (see chart 16). Although the ratio has improved to 77.8% more recently (4Q15), many households remain heavily indebted. According to Citi, middle-high income earners (earning between R43 000 and R63 000 per month) and high-income earners (earning above R64 000 per month) took advantage of lower interest rates following the global financial crisis and de-levered notably, whereas an increase in unsecured lending amongst the lower-income earning groups left overall debt ratios at a higher level by the end of 2015 (see chart 17). However, with interest rates rising by 200 basis points since January 2014 in response to rising inflation pressures, a sticky external deficit and stubbornly-high inflation expectations, the debt-servicing burden of consumers has risen.
Chart 16: Households are still heavily indebted (%)
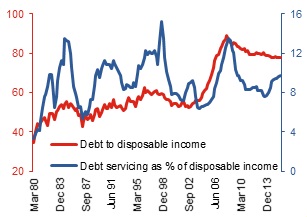
Source: Global Insight, Momentum Investments, data up to 4Q15
Chart 17: Consumer leverage varies across income
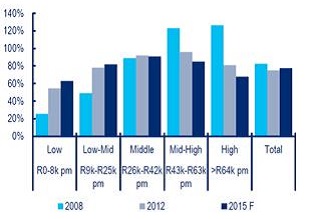
Source: Citi
Pressure on real income caused by a rising inflation trajectory and a bleak jobs outlook may have tempered loan demand in a rising interest rate environment. Growth in the number of loan applications received stalled in late 2015. Though the supply of loans eased up with the National Credit Regulator data signalling a decrease in the rejection rate, over half of the loan applications received were not successful in the final quarter of 2015 (see chart 18). Subsequently growth in consumer credit has remained tepid across the board (see chart 19), dampening consumer spend further.
Chart 18: Half of applications received are rejected
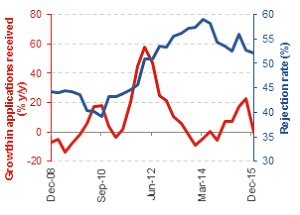
Source: NCR, Momentum Investments
Chart 19: Muted growth in consumer credit (% y/y)
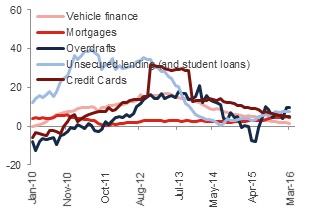
Source: SARB, Momentum Investments
While we expect a marginal acceleration in growth in unsecured loans, we expect this to occur at the middle- to upper-income earning brackets as credit providers shift their focus away from lower-income earning groups who have levered up significantly since 1Q08. The challenging economic backdrop will likely leave lower-income earners facing increasingly stringent lending conditions, further limiting their spending capacity.
When household credit growth peaked in 2007 (at above 27% y/y), 65% of the total number of unsecured loan agreements were allocated to those earning below a gross monthly income of R5 500. This ratio subsequently declined to 20% of all loans in 1Q15 and has since risen marginally to 27% (see chart 20).
Credit providers have once again shifted their focus to extending larger-sized loans. In 4Q08, 59% of unsecured loans granted were larger than R5 000. This ratio decreased to 47% in 1Q15 as risks in this sector increased, but the ratio has once again increased to nearly two-thirds of all unsecured loans granted (see chart 21).
While very few of the loans have a term longer than five years, over half of them have a duration of between eighteen months and five years. This is slightly lower than the 60% peak it reached in 4Q07, but higher than the 40% share in 1Q15 when credit lenders became increasingly cautious.
Chart 20: Lending focus remains on middle and upper-income
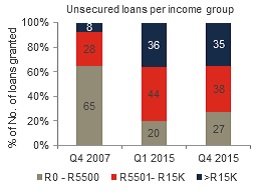
Source: NCR, Momentum Investments
Chart 21: Credit providers still providing large-sized unsecured loans
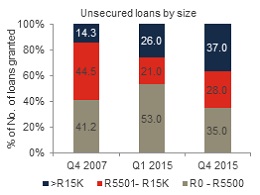
Source: NCR, Momentum Investments
Diminishing tailwinds for upper-income households
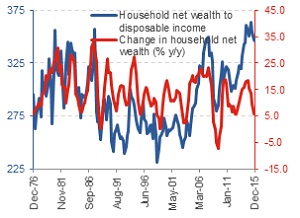
Low-income earners are primarily dependent on social grants as a source of income, while middle-income earners rely mostly on their wages/salaries. Upper-income households on the other hand are reliant not only on their salaries, but net profits and investments contribute significantly to their overall income. Although net wealth recorded an all-time high of R3 trillion in 4Q15, the rate of change in household net wealth has slowed to 5.8% y/y in 4Q15 from the previous four-quarter average of 11.1% (see chart 22) which is likely to have less of a positive impact on consumer confidence in upcoming quarters.
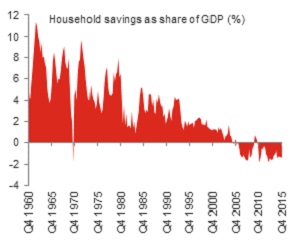
Lower levels of savings leave consumers in a more vulnerable position during tough economic times. Household savings for SA households as a whole are currently negative as a share of GDP (see chart 23) and remain highly skewed, with upper-income earners exposed to a higher level of savings. Low employment growth, a rising tax burden, an inflationary environment and subdued consumer confidence have inhibited a higher household savings culture in SA, leaving the savings sub-component of the Consumer Vulnerability Index in the “mildly exposed” zone.
Chart 22: Household net wealth still growing, but at a slowing pace
Source: Global Insight, Momentum Investments
Chart 23: Overall household savings remain low (% y/y)
Source: SARB, Momentum Investments
More onerous taxes on the horizon
Finance Minister Gordhan avoided the implementation of more onerous tax hikes in the February 2016 budget in light of a fragile economic backdrop, but managed to adhere to the fiscal consolidation timeline through promising a R25 billion cut in the civil servant wage bill over the next three-year period. With economic headwinds likely to persist well into 2017 and little progress on structural reform to boost longer-term growth prospects much above 2% over the next five-year horizon, revenue collection is likely to become an increasingly challenging task, leaving Treasury with little option but to raise tax rates, providing an additional headwind to SA consumers.
Although the backdrop of a slowing growth environment challenges a decision to raise consumption taxes on a broader base rather than increase the tax burden on a small base of higher-income earners, Treasury may have little choice but to deliver on both in order to improve the fiscal trajectory and appease rating agencies.
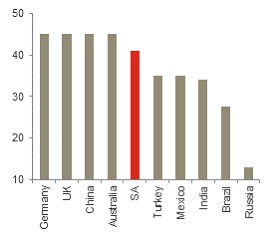
SA’s personal income tax (PIT) base remains small, with 4% of taxpayers paying 40% of tax assessed (see chart 24). Based on data from the 2015 SARS Tax Statistics document, raising the marginal personal income tax rate from the current 41% level (see chart 25) to 43% for those earning in excess of R1 million per year (i.e. 2.6% of total taxpayers accounting for 16.8% of total taxable income), could yield up to an additional c.R4 billion per year. Given poor economic conditions, the idea of a “super tax bracket” targeting the richest citizens has surfaced. A super tax had previously been levied in the country in the 1980s, but the bracket had been subsequently adjusted lower after a recommendation by the Katz Commission. However, focusing on those earning above R5 million per year would target less than 0.1% of the total taxpayers in SA (i.e. 3.2% of total taxable income), suggesting that little additional revenue would be generated. Similarly, raising taxes on investment-related income such as estate duties, dividends and capital gains would likely be considered, but would garner little additional revenue.
Chart 24: Skewed PIT distribution
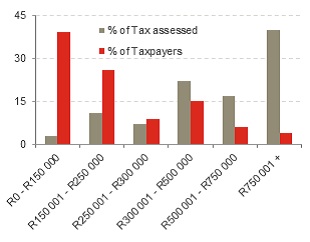
Source: National Treasury, Momentum Investments
Chart 25: PIT country comparison
Source: Citi, Momentum Investments
At 14% (and unchanged since 1993), VAT rates in SA remain reasonably low based on a global comparison (see chart 26) and are notably lower than the 16% average across emerging markets. On our calculations, a 1% rise in the VAT rate could garner an additional R20 billion in revenue. However, as per Macquarie’s estimations, more than 50% of the spending of the poorest decile of households (categorised as spending less than R22 000 per year) are still subject to VAT. This could imply that government would need to widen the range of items that are zero-rated or subsidise the poor to partly offset the impact of a VAT rise, in an effort to adhere to the principle of raising revenues in a fair and efficient manner. According to RMBMS, 38.3% of SA’s CPI basket is currently VAT exempt. This includes items such as owner’s equivalent rent, petrol, used vehicles, education and basic food items. RMBMS estimates that a 50% pass-through of a 1% increase in the VAT rate would raise CPI by 0.31%, increasing to 0.62% using a 100% pass-through estimation, only taking the direct impact into account (see chart 27).
Chart 26: Room to raise VAT in SA
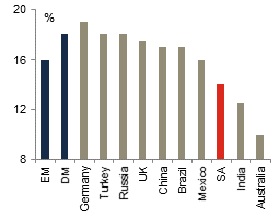
Source: Citi, Momentum Investments
Chart 27: Direct CPI impact of a 1% VAT hike (%)
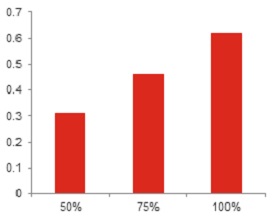
Source: RMBMS, Momentum Investments
Outlook for the SA consumer
We remain cautious on the outlook for consumer spend over the remainder of this year and next. While the upper-income household has de-levered significantly since the global financial crisis, a rising interest rate environment points to a larger debt-servicing burden. Volatile financial markets and slow house price growth further point to a slowdown in the growth rate of household net wealth, highlighting fading support for upper-income earners. Anaemic jobs growth, rising levels of indebtedness and increasing food prices are expected to leave low-income consumers in a vulnerable position this year, particularly given their low level of savings, although better expected weather conditions could see a sharp reversal in food prices in 2017, hence alleviating pressure on the lower-income earner. Possible tax hikes next year pose further headwinds to household consumption expenditure and as such we project an average growth rate of 0.3% in this category over 2016 and 2017, before picking up closer to 2% in the years that follow as higher business confidence (improved global backdrop given rising commodity prices and an increase in domestic electricity capacity) encourages faster jobs growth and lower inflation (firmer rand prospects) aids a recovery in real disposable income growth.
