Momentum Macro Bulletin – A gauge of the SA macro temperature

Sanisha Packirisamy, Economist at MMI Holdings.

Herman van Papendorp (Head of macro research) at MMI Holdings.
Sanisha Packirisamy (Economist) and Herman van Papendorp (Head of macro research) from MMI Holdings have put together a Macro Bulletin to gauge South Africa’s current macro temperature.
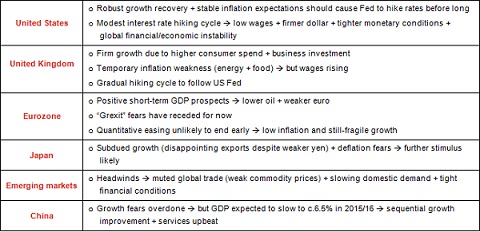
Global overview
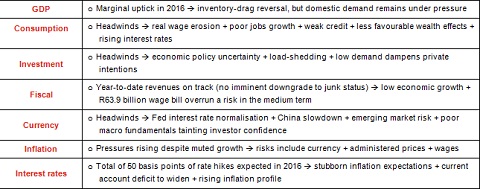
SA overview
SA data snapshot
Consumer Price Inflation (CPI)
Latest: 4.6% y/y (September 2015)
Previous: 4.6% y/y (August 2015)
• Headline inflation steadied at 4.6% y/y in September and remained unchanged on a month-on-month basis.
• Actual and owners’ equivalent rentals (which account for a cumulative 15.7% of the consumer inflation basket) increased by 1.4% m/m in September, leaving the year-on-year rate of rental inflation close to 4.9%.
• The decrease in transport prices was largely due to the sizeable 69c/l cut in the petrol price in September. The relatively small 4c/l hike in petrol prices in October is unlikely to move the dial on the next inflation (October) print, but current movements in the rand oil price suggest a potential 14c/l over-recovery in November.
• Food prices inched higher by 0.1% m/m (4.4% y/y) in September. However, if we lead the year-on-year growth rate in yellow maize prices (in rand terms) by twelve months, higher rates of food inflation are still on the horizon (see chart 1).
• Notwithstanding the rand’s 20.5% depreciation against the US dollar (and 10.1% depreciation on a trade-weighted basis) over the past twelve months, currency pass-through has been limited.
• With consumer demand likely to remain under pressure in 2016 (largely owing to a slower rise in real disposable income and tepid employment growth), it will remain a tough environment for SA corporates to pass on cost increases. We expect inflation to average 4.7% in 2015 and 5.8% in 2016, peaking at around 6.2% in 1Q16, breaching the target for a quarter, before moving lower to an average of 5.2% in 2017.
Chart 1: Food inflation expected to rise
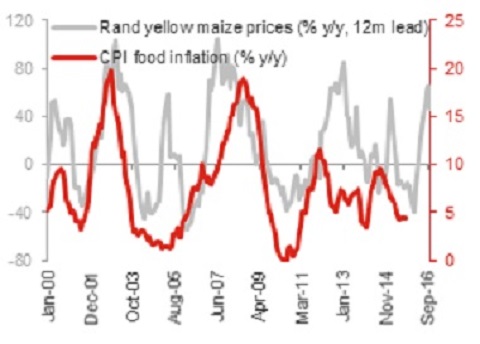
Source: Stats SA, Global Insight, Momentum Investments
Retail sales
Latest: 3.9% y/y (August 2015)
Previous: 3.3% y/y (July 2015)
• Retail sales growth surprised to the upside increasing by 3.9% y/y in August, following a firm 3.3% y/y rise in July.
• Growth in sales of building materials and textiles/clothing remained upbeat, increasing by 4.3% and 4.7% y/y, respectively, in August. These two components accounted for nearly 30% of overall retail sales volumes in August.
• The largest sector, namely sales by general dealers (e.g. grocery stores), experienced healthy growth of 3.9% y/y in August, considerably higher than the year-to-date run rate of 2.4% y/y.
• Although retail sales have largely surprised to the upside, forward-looking indicators, including retailer sentiment and the Consumer Confidence Index (see chart 2), point to increasingly challenging conditions ahead as consumers are expected to face rising inflation pressures, weak employment prospects and little acceleration in household credit.
Chart 2: Poor retail and consumer confidence
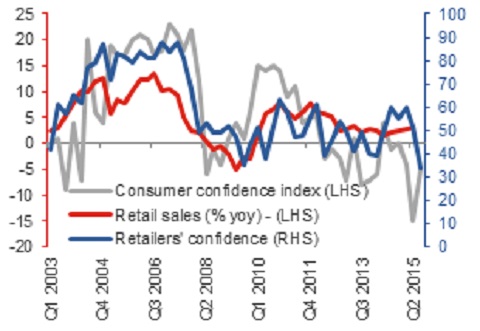
Source: Stats SA, BER, Global Insight, Momentum Investments (data up to 3Q15)
Vehicle sales
Latest: -9.1% y/y (September 2015)
Previous: -8.4% y/y (August 2015)
• Total market vehicle sales have declined for the sixth consecutive month in year-on-year terms. The number of vehicles sold in September dropped by 9.1% y/y, following an 8.4% y/y decline in August.
• Naamsa (National Association of Automobile Manufacturers of South Africa) vehicle sales data declined by a lesser 8.3% y/y in September, highlighting increased stress at the lower end of the market, given that the Naamsa data excludes the impact of the AMH/AAD vehicle sales which are targeted at the lower end of the market. AMH/AAD vehicle sales accounted for 10% of the total vehicles sold in September.
• Total passenger vehicle sales collapsed by 13.2% y/y in September as consumers continued to face increasing headwinds deterring the purchase of durable goods.
• Naamsa expects further downgrades to domestic vehicle sales estimates as challenging economic conditions are expected to persist over the medium term.
• Export volumes, meanwhile, continued to surprise positively (see chart 3). Exports reached a new monthly record in September at 35 181 units.
• Naamsa expects the ongoing global economic recovery to support higher exports of SA produced vehicles to nearly 100 international markets between 2015 and 2017.
Chart 3: Weak growth in domestic vehicle sales
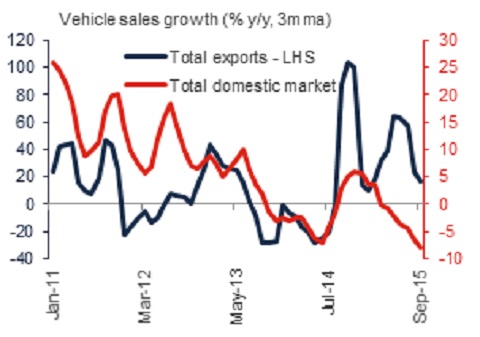
Source: Global Insight, Momentum Investments
Consumer confidence
Latest: -5 index points (3Q15)
Previous: -15 index points (2Q15)
• The FNB/BER Consumer Confidence Index (CCI) staged a recovery in 3Q15, bouncing off 2Q15 lows, but remained in negative territory for the fifth consecutive quarter.
• The increase in the overall CCI reading, from -15 index points in 2Q15 to -5 in 3Q15 reflected less pessimism on all three of the underlying questions in the consumer survey. These include consumers’ outlook for their own personal finances over the next year, the economic outlook over the next twelve-month period and whether the present time was appropriate to purchase durable goods.
• Although a net 11% of consumers expect an improvement in their finances a year from now, a net 15% see a deterioration in the economy over the same time period and a net 9% believe that the current time to buy durable goods remains unfavourable.
• There remains a sizeable gap in confidence levels between the higher-income earners and the lower-income earners (see chart 4). However, confidence readings for the highest-income earning group (earning more than R14 000 per month) barely registers in positive territory indicating pressure at this end of the market as well. This is likely due to the volatility in the equity market and the expectation of higher interest rates, while the lowest-income earning group remains pessimistic given a poor employment backdrop.
Chart 4: Downbeat consumers
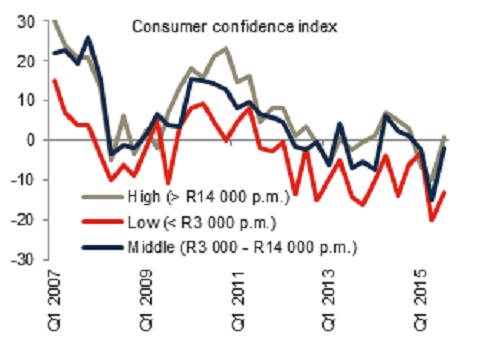
Source: BER, Momentum Investments
Private sector credit extension
Latest: 8.6% y/y (August 2015)
Previous: 8.4% y/y (July 2015)
• Private sector credit extension (PSCE) rose by 8.6% y/y in August after increasing at 8.4% in July, broadly in line with the 8.7% average increase on a year-to-date basis.
• Growth in household credit continued to underperform growth in corporate lending. Household credit rose by 4.2% y/y in August – the highest growth rate in thirteen months – but this was significantly lower than the 11.4% y/y growth rate observed in the corporate lending category.
• Within the household credit category, growth in mortgages (which account for nearly 60% of total household lending) increased by 3.5% y/y in August – the highest rate in nearly four and a half years. Household credit growth was strongest in the overdrafts (+10.0% y/y) and credit cards (+7.4% y/y) categories in September, while unsecured lending (accounting for just under 15% of total household credit) continued to recover to 6.0% y/y in September from a low of 0.2% y/y in July 2014.
• Nearly half of the 11.4% y/y increase in corporate credit in September was driven by the 13.1% y/y increase in unsecured lending. Robust growth rates in unsecured lending by corporates have coincided with a slowdown in growth in corporate profitability suggesting that corporates may have ramped up short-term lending facilities in order to meet short-term financing needs.
• Benign growth in household lending is unlikely to promote higher growth in consumer spend in the upcoming year, while firm growth rates in corporate lending are not reflective of an increase in corporates’ intentions to ramp up fixed investment spend.
Chart 5: Subdued growth in household credit
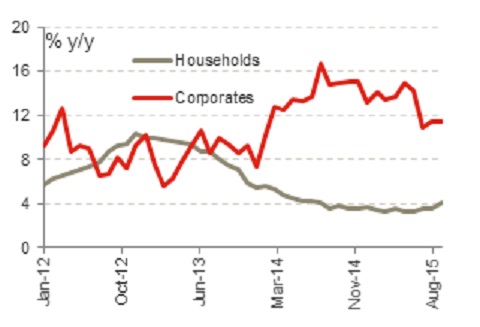
Source: SARB, Momentum Investments
Employment
Latest: 25.5% unemployment rate (3Q15)
Previous: 25.0% unemployment rate (2Q15)
• According to Stats SA’s Quarterly Labour Force Survey (QLFS), total unemployment increased by 188 000 to 5.4 million in 3Q15 from 5.2 million in 2Q15. Over the same time period, the number of employed workers increased by 171 000, leaving the number of employed persons in SA higher at 15.8 million in 3Q15 relative to the 15.7 million recorded in 2Q15.
• The rate of unemployment in SA is arguably higher given the elevated number of discouraged work-seekers in SA (those who have given up looking for employment opportunities for a period longer than four weeks). The number of discouraged work-seekers remains high at 2.2 million, although it has come down from a peak of 2.5 million in 3Q14.
• Of the 171 000 jobs created in 3Q15, 95 000 came from employment generated in the formal sector, taking total formal employment higher to 10.9 million. 60 000 Informal jobs were created in 3Q15 with the agriculture sector creating an additional 28 000 jobs while private households (including domestic workers and gardeners) shed 12 000 jobs over the corresponding period.
Chart 6: Quarterly employment change by sector (‘000’s)
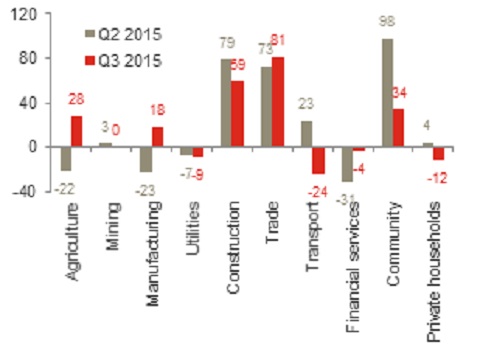
Source: Global Insight, Momentum Investments
• Within the formal sector, quarterly job gains in 3Q15 were the highest in the construction (+59 000) and trade industries (+81 000), followed by a 34 000 increase in the government sector. Jobs continued to be shed in the utilities (-9 000), transport (-24 000) and financial services (-4 000) sectors in 3Q15 (see chart 6).
• Unemployment rates remained highest for the Black (28.8% in 3Q15 from 27.9% in 2Q15) and Coloured (22.8% in 3Q15 from 24.4% in 2Q15) populations and lowest for the Asian (12.5% in 3Q15 from 13.4% in 2Q15) and white populations (5.9% in 3Q15 from 7.0% in 2Q15).
• Unemployment rates were highest for those who did not complete secondary schooling at 32.5% and lowest for those with a tertiary education (7.6%).
• Low growth of below 1.5% this year and 1.7% in 2016 is unlikely to support a significant recovery in employment growth in 2016. Subdued growth prospects and fragile business confidence continue to suggest a challenging environment for job creation and higher rates of fixed investment.
Purchasing Managers’ Index
Latest: 49 index points (September 2015)
Previous: 48.9 index points (August 2015)
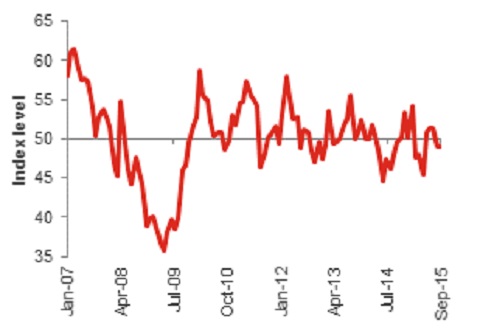
• The BER/Barclays Purchasing Managers’ Index (PMI) remained relatively unchanged at 49 index points in September, up only marginally from 48.9 points in August.
• Unsatisfactory conditions were noted in the dip in current business activity levels from 48.6 points in August to 46.6 points in September.
• Inventories were scaled back with the inventory sub-index dropping to 50.3 index points as firms factored in weak domestic consumer demand.
• A further rise in the price sub-index to 77.6 points in September, pointed to further input cost pressures, while employment intentions remained in negative territory.
• On a more positive note, the new orders component (indicative of future demand) rose for a second month in a row to 51.9 index points potentially as a result of firmer global demand (arising from the Eurozone in particular) underpinning exports given that consumer demand remained under pressure domestically.
• We maintain a cautious outlook on the manufacturing sector given the slowdown in China and the negative impact on commodity prices, potentially resulting in adverse spillover effects into SA’s manufacturing industry.
Chart 7: Manufacturing sentiment in negative territory
Source: INET BFA, Momentum Investments
Mining and manufacturing production
Latest mining: 4.6% y/y (August 2015), latest manufacturing: 0.6% y/y (August 2015)
Previous mining: 4.6% y/y (July 2015), previous manufacturing: 5.3% y/y (July 2015)
• Stats SA mining production volumes increased by 3.8% y/y in August (4.0% y/y in July), but contracted by 1.1% in month-on-month terms as low global commodity demand kept mining volumes under pressure.
• Production in the platinum group metals (PGMs) sector was the largest growth contributor to overall mining growth in year-on-year terms, while a fall in iron ore production volumes detracted the most over the same time period.
• Coal production shaved off a further 1.5% from overall growth in mining production volumes in August.
• Potentially lower strike-induced coal production volumes add further downward pressure on future mining performance, given this sector’s hefty c.25% weight of the total mining production basket.
• Benign global commodity demand and weak commodity prices cloud the outlook for SA’s mining industry, while uncertainty over economic policy and labour unrest will likely prevent a faster acceleration in capital expenditure and employment growth in the sector.
• Manufacturing production volumes declined by 0.2% y/y in August, after posting an upbeat 5.3% y/y print in July, disappointing market expectations for a 1.4% y/y rise.
• According to Stats SA, the largest negative contribution was made by the basic iron and steel, metal products and machinery divisions, while the petroleum/chemicals and food/beverages sectors were the largest positive contributors to year-on-year growth in August.
• Growth in production volumes has been particularly poor in the furniture and clothing sectors. Here, production volumes fell by 34.4% and 24.3%, respectively, relative to 1Q08 levels (see chart 8). Meanwhile growth in production volumes has been stronger in the electrical machinery, food/beverages and communication equipment sectors, resulting in levels which are 35.6%, 25.4% and 23.5% higher (respectively) in comparison to 1Q08 levels.
Chart 8: Manufacturing volumes since 1Q08 (% change)
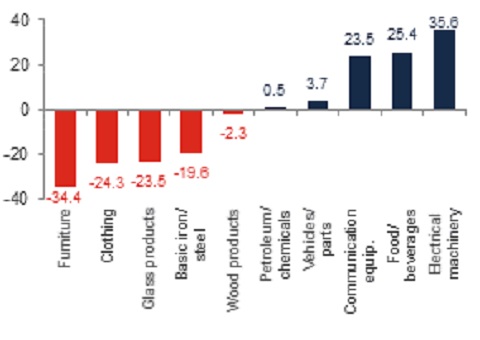
Source: Stats SA, Global Insight, Momentum Investments
Quarterly Bulletin
Latest: -3.1% current account balance to GDP (3Q15)
Previous: -4.7% current account balance to GDP (2Q15)
• The South African Reserve Bank’s (SARB) Quarterly Bulletin confirmed that real GDP growth slowed to 1.6% y/y in 2Q15 from 2.0% y/y in 1Q15.
• Domestic demand played a minor role in supporting overall GDP growth in the second quarter of the year, which contracted by 1.3% in q/q seasonally adjusted annualised terms (saar) in 2Q15 following a 1.3% rise in 1Q15.
• Inventories plummeted in 2Q15 (see chart 9) partly on the back of a rundown in platinum inventories in the mining sector, while crude oil volumes were also reduced in line with scheduled maintenance shutdowns at some of the country’s major oil refineries.
• The decline in the residual (the unexplained portion of GDP) reached its highest level on record, further detracting from overall GDP growth in 2Q15.
• Real expenditure by households slowed to 1.2% q/q saar in 2Q15 from 2.4% in the previous quarter as higher taxes and fading favourable fuel price gains eroded real disposable incomes. Growth in both discretionary and non-discretionary spend slowed over the second quarter of the year reflecting broad-based weakness.
• Growth in total fixed investment slowed sharply from 2.3% y/y in 3Q14 to 0.2% y/y in 2Q15, with growth outside of government infrastructure remaining soft. Growth in private spend inched higher to 1.1% y/y in 2Q15 following four consecutive quarters of negative growth.
• Although weak infrastructure spend appears to be a global phenomenon, an erosion in capital infrastructure bodes ill for SA’s growth capacity further down the line. Admittedly, SA’s total fixed investment-to-GDP ratio remained at 20.4% in 2Q15, unchanged relative to levels last seen in 2008/2009, but the share of private spend has fallen from its 15.4% peak in late 2008 to c.13% in 2Q15.
• SA’s national savings relative to GDP dipped from 16.4% in 1Q15 to 16.0% in 2Q15 largely due to a decrease in savings by the corporate sector, which offset a decrease in dissavings by general government.
• A robust export performance and slowing imports led to SA posting its first trade surplus in three and a half years in 2Q15. Exports climbed by 13.9% y/y in volume terms during the second quarter of the year, up from 5.6% y/y in 1Q15 owing to higher mining, chemical and vehicle (mainly to the US, Germany and Belgium) exports, while import growth increased by 7.1% y/y from 4.8% a quarter ago. In quarter-on-quarter terms import volumes edged down on lower oil imports and softer domestic demand.
• Going forward, we expect a deterioration in the trade surplus given benign global trade conditions and muted commodity prices.
Chart 9: 2Q15 Real GDP stack-up (% q/q saar)
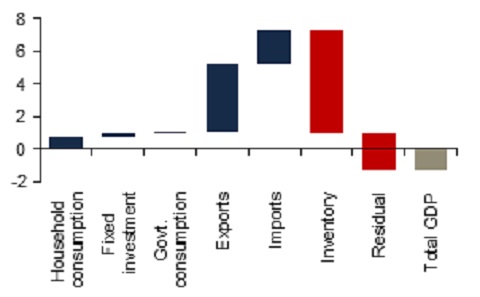
Source: Global Insight, Momentum Investments
Medium term budget
Latest: -3.8% government deficit to GDP ratio in FY2015/16 (October 2015)
Previous: -3.9% government deficit to GDP ratio in FY2015/16 (February 2015)
• Against the backdrop of a more subdued global economic recovery and muted domestic prospects, National Treasury has had to revise down their real GDP growth forecasts between FY2015/16 and FY2017/18 by 0.5% (on average), leaving the three-year average close to our own internal forecasts projected at 2%. The largest growth revision has been to FY2015/16 where weaker commodity prices and energy supply constraints have prohibited higher rates of growth.
• Nominal GDP growth estimates over the same time period have been adjusted down by a lesser 0.4% (on average), given upward revisions to Treasury’s inflation profile, on the back of electricity tariff concerns and a weaker currency.
• High public (and private) wage settlements were behind the higher-than-expected personal income tax (PIT) and value-added tax (VAT) collections so far in FY2015/16, allowing for a slight narrowing in the (consolidated) budget deficit-to-GDP ratio to 3.8% from the 3.9% level predicted in February this year. Lower growth estimates have nevertheless shaved off R34.6 billion from gross tax revenues over the next three fiscal years, while total expenditure was ramped up by a further R37.7 billion over the corresponding period.
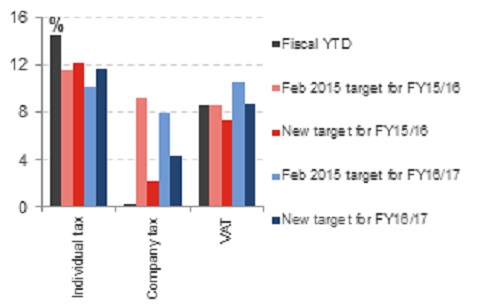
• The combination of a poorer outlook on growth and a higher-than-budgeted for wage bill (overrun of R63.9 billion) suggests a delay in fiscal consolidation. Weak consumer confidence, tight credit conditions and anaemic employment growth pose a threat to the relatively robust personal income tax buoyancy observed over the past year, while muted commodity prices and benign demand is expected to weigh negatively on corporate revenue collections (see chart 10).
• Notwithstanding challenging economic circumstances, Treasury has committed to adhering to the expenditure ceiling, which when using the consolidated budget figures implies real non-interest expenditure growth at an average of 2.5% p.a. between FY2015/16 and FY2018/19.
• Government attributes the deterioration in the debt-to-GDP ratio to a weaker currency and lower growth leading to revenue shortfalls. The gross debt-to-GDP ratio is expected to climb further to 49% of GDP by FY2017/18 (1.4% higher than projected in the February 2015 National Budget).
• Due to the increase in government borrowing, debt-servicing costs are expected to remain the fastest-growing expenditure item, increasing at an average rate of 11.1% y/y p.a. over the next three fiscal years.
Chart 10: Optimistic FY2016/17 revenue targets
Source: National Treasury, Momentum Investments
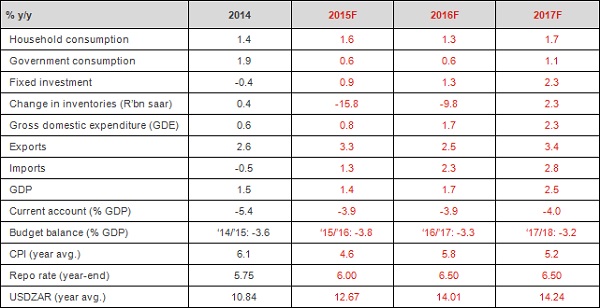
SA macro projections