
Expenditure side of SA GDP confirms sluggish growth in domestic demand

Sanisha Packirisamy, Economist at MMI Holdings.

Herman van Papendorp (Head of macro research) at MMI Holdings.
The South African Reserve Bank’s (SARB) Quarterly Bulletin confirmed that real GDP growth slowed to 1.2% y/y in 3Q15 from 1.6% y/y in 2Q15.
Softer growth in domestic demand as spend by households and firms slows
In line with depressed business and consumer confidence indices, growth in both household consumption and fixed investment spend continued to slow in year-on-year terms (see chart 1). Increased fiscal strain has further led to a deceleration in growth in government consumption suppressing growth in domestic demand. According to the Reserve Bank, the contraction in government spend on non-wage goods and services had been offset by an acceleration in government employee compensation, resulting in growth of 0.1% y/y in 3Q15 – the slowest rate since mid-1999.
Chart 1: Slower growth in household spend, government consumption and fixed investment (% y/y)
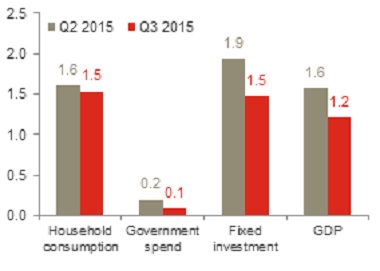
Source: Global Insight, Momentum Investments
Following a sharp R38.9 billion decline in inventories in 2Q15, firms continued to scale back in 3Q15 as weak domestic demand prospects prevented major restocking from occurring. The R31.6 billion contraction in overall inventories in the third quarter was largely as a result of destocking in the manufacturing sector in the food/beverages industry as well as the petroleum sector, as less crude oil was imported over 3Q15. Nevertheless, given the slower pace in inventory destocking between 2Q15 and 3Q15, inventories were a net positive contributor to real GDP growth in 3Q15 (see chart 2) on a quarterly basis using seasonally-adjusted annualised data (saar).
Meanwhile the real GDP growth detraction by the residual, or unexplained portion of economic activity, reached a new record level of nearly R74 billion (see chart 3), shaving a further c.1% off from overall economic activity in the third quarter. Overall, net trade (exports less imports) shaved off 0.1% from overall GDP growth in 3Q15.
Chart 2: Real GDP growth stack-up in 3Q15 (% q/q saar) boosted by slower destocking
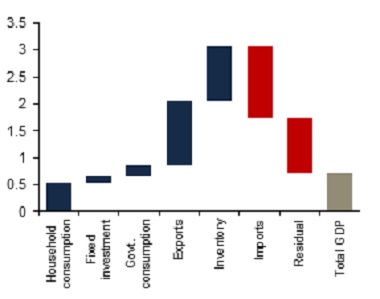
Source: Global Insight, Momentum Investments
Chart 3: Largest negative residual captured on record since 1960
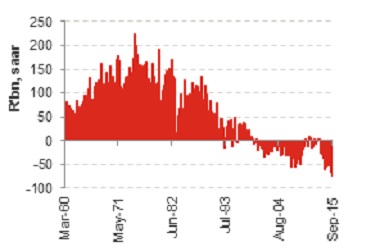
Source: Global Insight, Momentum Investments
Households are feeling the pinch of a tough economic climate
Real expenditure by households slowed to 0.9% q/q saar (1.5% y/y) in 3Q15 from 1.2% q/q saar (1.6% y/y) in the previous quarter thanks to a moderation in real income growth and downtrodden sentiment. A deep contraction in passenger vehicle sales led to a 4.9% q/q contraction in durable goods spend in seasonally-adjusted annualised terms in 3Q15 (0.4% y/y), from a 0.2% increase in 2Q15. Negative growth was also recorded in the volume of non-durable goods purchased at -0.2% q/q saar (0.9% y/y) in 3Q15, slowing from a sharper 0.7% q/q contraction in the previous quarter. The SARB attributes weak levels of household spend to elevated debt ratios, low consumer confidence and tepid growth in employment. Furthermore, should oil prices stabilise or drift higher in 2015 as we expect, lower real wage growth (owing to base effects) will prevent a higher acceleration in household spend from growth levels of around 1.5% expected for 2015 as a whole.
Chart 3: Growth in household durable items hit the hardest (% y/y)
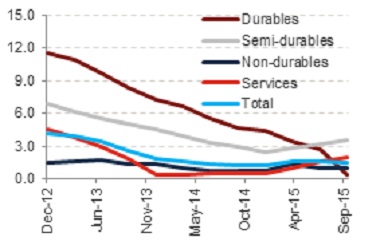
Source: SARB, Global Insight, Momentum Investments
Although household net wealth ratios remain close to recent highs (see chart 4), less favourable conditions in the SA housing market and the recent underperformance in the equity market point to softer growth in net wealth suggesting some financial strain, even at the upper end of the income-earning spectrum. Furthermore, an additional 25 basis point hike in interest rates expected in early 2016 will reduce purchasing power for middle and upper-income earners owning a mortgage. Nonetheless, higher savings at this end of the market will continue to support spend, while rising inflation and a dismal employment outlook will continue to weigh negatively on lower-income earners.
Chart 4: Less favourable wealth effects and elevated debt ratios weigh negatively on household spend
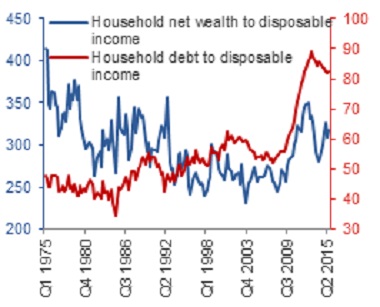
Source: SARB, Momentum Investments, data up to 3Q15
Growth in fixed investment grinds lower
Growth in total fixed investment decreased from 1.0% q/q saar (1.9% y/y) in 2Q15 to 0.6% q/q saar (1.5% y/y) in 3Q15, with growth outside of government infrastructure underperforming (see chart 5). Growth in infrastructure outlays by general government remained firm at 5.3% y/y in 3Q15, averaging close to 4.0% since the global financial crisis (GFC), while growth in spend by SA’s state-owned enterprises (SOEs) and private sector slowed to 0.6% and 0.7% y/y in 3Q15, respectively. According to the SARB, the mildly positive growth rate in private spend was buoyed by purchases of machinery and equipment in the construction and transport sectors.
Chart 5: Paltry growth in capex spend by SA’s corporates (% y/y)
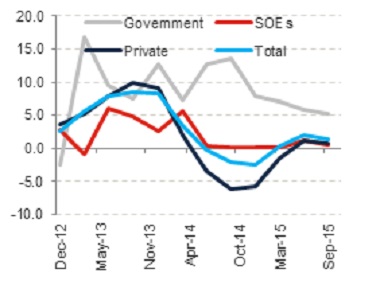
Source: SARB, Global Insight, Momentum Investments
Although private firms still accounted for the largest share of fixed investment spend at 62% in 3Q15, this ratio has fallen from 71% just prior to the GFC. Since the crisis, private investment growth has averaged 2.5% in comparison to the 4.5% growth rate experienced in the long-run since 1960. Business confidence has failed to gain meaningful traction since the crisis given excess capacity (as reflected by the persistence in the negative output gap), the subdued outlook on domestic demand and a less favourable operating environment on the back of electricity supply concerns and lingering economic policy uncertainty.
The Bureau of Economic Research’s (BER) manufacturing survey points to an unfavourable political climate (which includes labour market instability and energy bottlenecks), insufficient demand and a lack of skilled labour as being the major constraints faced by domestic manufacturers when considering additional fixed capital spend in the domestic economy (see chart 6). Net negative capex intentions signal further downside risk to fixed capital formation in upcoming quarters (chart 7), before seeing an expected modest turnaround in 2017 as more electricity capacity comes online.
Chart 6: Key fixed investment constraints faced by domestic manufacturers
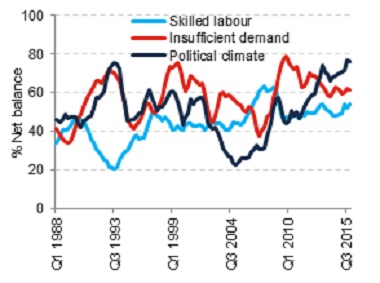
Source: BER, Momentum Investments
Chart 7: Poor investment intentions signal muted growth in private capex (GFCF) in upcoming months
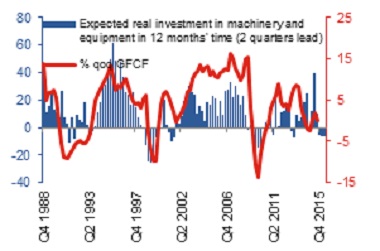
Source: BER, Momentum Investments
Deterioration in aggregate savings ratio
SA’s national savings rate (relative to GDP) fell from 16% in 2Q15 to 15.2% in 3Q15 as a dip in government savings offset a higher savings ratio recorded by corporates (see chart 8). The corporate savings ratio edged higher to 14.7% in 3Q15 from 14.3% in the prior quarter while government savings slipped from 1.5% of GDP to 0.3% over the same time period. Household savings tracked largely sideways at 0.2% of GDP, leaving household consumption broadly in line with consumer income in the third quarter of the year.
Chart 8: Dip in national savings ratio (4q ma, %)
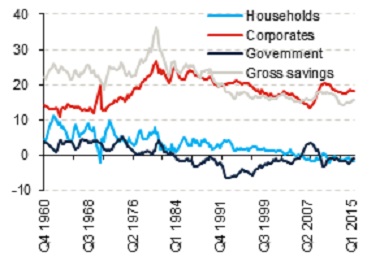
Source: SARB, Global Insight, Momentum, data up to 3Q15
Current account widens as imports rise more strongly than exports
According to the SARB, the deterioration in SA’s trade account was largely due to an acceleration in imports of foreign-produced intermediate and consumption goods while lower manufactured export volumes (chemicals in particular) partly offset an uptick in mining exports. Export quantities of platinum and iron ore fell further over 3Q15 while an increase in ferrochrome and coal to Spain, Morocco and the Netherlands increased. Iron ore exports are likely to come under further strain given Chinese authorities’ attempt at reducing air pollution. While agricultural exports rose on the back of edible fruits, unfavourable weather conditions are likely to dampen agricultural exports in upcoming quarters, placing further pressure on the overall current account deficit particularly as the import penetration ratio remains sticky (imports currently tracking at 30.8% of GDP).
Chart 9: Sticky income deficit and negative swing in trade balance drive current account deficit wider (% of GDP)
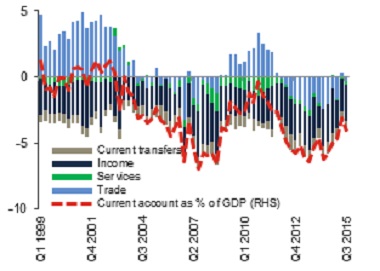
Source: SARB, Global Insight, Momentum Investments
Although SA’s terms of trade improved slightly in 3Q15 (as the rand price of exports accelerated above that of imports), the terms of trade proxy (developed by Deutsche Bank) suggests a sideways movement over 4Q15 (see chart 10). The proxy is based on exported platinum and gold prices as well as imported oil prices.
Chart 10: Terms of trade proxy points to little improvement in 4Q15 (index values)
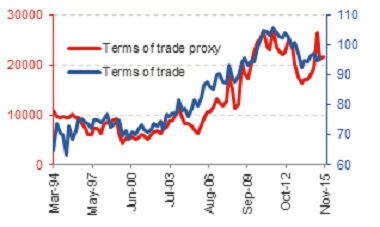
Source: SARB, Global Insight, INET BFA, Momentum Investments
Meanwhile, the income deficit remains large at 2.7% of GDP (or R107.6 billion) as SA continues to disburse dividend payments to foreign-holders of SA bonds and equities, outstripping dividend receipts. The net services deficit accounted for 0.3% of GDP in 3Q15, widening from 0.2% in 2Q15 as gross travel receipts remained under pressure. A recent alleviation in onerous visa regulations could still take some time to show up in higher tourism arrivals going forward.
Balance on financial account improves as net other investment and unrecorded transactions increase
The balance on the financial account increased in 3Q15 as a result of a R38.7 billion increase in unrecorded transactions (after posting three consecutive quarters of negative prints) and a R45 billion increase in net other investments, owing to a rise in non-resident deposits (see chart 11). Net foreign direct investment increased by a mere R1.3 billion in 3Q15, while net foreign portfolio outflows of R12.4 billion (1.2% of GDP) were recorded over the corresponding period.
Chart 11: Net other investment and unrecorded transactions behind the boost in the financial account in 3Q15 (R’bn)
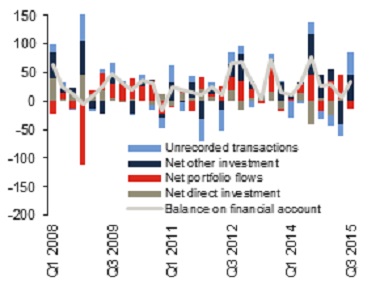
Source: SARB, Global Insight, INET BFA, Momentum Investments
Recent market turmoil induced by emerging market growth fears and the prospect of higher interest rates in the United States have led to an outflow in net foreign portfolio investment in both bonds and equities (see chart 12). The pattern has remained consistent on a quarter-to-date basis suggesting that the funding mix will continue to be more reliant on net other investment in 4Q15, particularly in light of a still-extended current account deficit.
Chart 12: Net foreign portfolio outflows observed in bonds and equities during November 2015
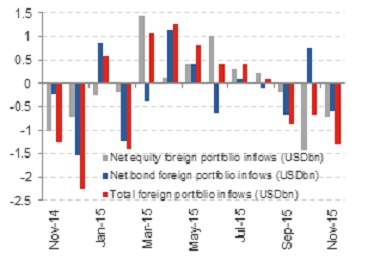
Source: SARB, Global Insight, INET BFA, Momentum Investments
Weak SA growth dynamics and downward pressure on trade balance
Going forward, we expect growth in domestic demand to remain weak as a deceleration in real wage growth, less favourable wealth effects and anaemic jobs growth weigh negatively on the SA consumer, while sharply slowing growth in corporate profitability, economic policy uncertainty, energy supply bottlenecks and depressed confidence are likely to limit growth in infrastructure spend in 2016. A constrained fiscal environment further dampens government’s ability to support growth to the same extent as they did in the years that followed the global financial crisis.
We expect muted global trade activity and little recovery in commodity prices to prevent a faster acceleration in export growth next year, while drought conditions could curb export growth even further. Higher food imports and a still-elevated import ratio will likely keep the current account deficit extended in excess of 4%, highlighting funding risks, which S&P ratings agency alluded to recently in their December ratings review, particularly as we near a potential lift-off in interest rates in the United States.
