
Economic and market snapshot for October 2015

Sanisha Packirisamy, Economist at MMI Holdings.

Herman van Papendorp, Head of macro research at MMI Holdings.
Global economic developments.
United States (US)
Market pushes out rate hike prospects on low wage growth, a firmer dollar and global concerns
Despite a firm growth environment and stable survey-based inflation expectations, the market has raised doubts over the federal funds rate lifting this year, forecasting the first hike of the next interest rate hiking cycle in March 2016. Low wage growth (in spite of evidence of reduced slack in the labour market), tighter monetary conditions (brought about by US dollar strength, see chart 1) and the potential for global financial and economic instability to generate a negative feedback loop into US growth has been behind the latest move in market sentiment.
Chart 1: Tightening in US financial conditions
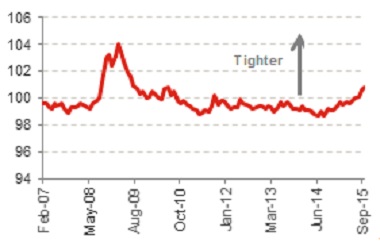
Source: Goldman Sachs, Bloomberg, Momentum Investments
Although recent economic activity has been surprising to the downside, the negative surprises have largely been concentrated in the manufacturing/industrial sectors of the economy, whereas data points related to the consumer/services sectors have been matching (or even exceeding in some cases) expectations. Moreover, further evidence of shrinking slack in the economy and stable services inflation (outside of the energy sector) suggest that rates will move up before long.
Eurozone
Quantitative easing (QE) programme unlikely to end before September 2016 on still-fragile growth and low inflation
Although growth in the near term is likely to benefit from a weaker euro, lower oil prices and a supportive monetary policy stance, recent movements in the trade-weighted euro and the expectation of a stabilisation in international oil prices point to signs of fading GDP support in 2016.
Chart 2: Tepid growth recovery in the Eurozone
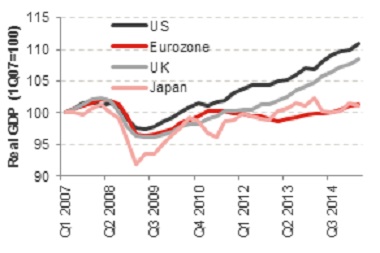
Source: Bloomberg, Momentum Investments, data up to 2Q15
The recovery in the Eurozone has been much weaker than the pace at which the US and United Kingdom (UK) have expanded since the global financial crisis (see chart 2). The persistence of a large negative output gap in the Eurozone and still-weak inflation prints point to the likely continuation of QE well into 3Q16. Should inflation prints disappoint further, an extension of QE, a faster pace of purchases or an additional cut in the deposit rate could be considered to spur inflation and growth via an expected weakening in the euro.
Japan
Subdued growth and renewed deflation risks highlight the need for further stimulus
Real growth is only 1.2% higher than the level experienced in the first quarter of 2007, prior to the global financial crisis. Since then growth rates have been particularly volatile, with exports disappointing recently (see chart 3) due to a reversal in the weakening pattern of the yen (against the US dollar) and softer Chinese demand. Of the major developed economies, Japan has one of the largest GDP exposures to Asia via exports. Almost 10% of Japanese GDP is reliant on exports to the rest of Asia, of which China accounts for nearly half.
Chart 3: Japanese export growth disappoints
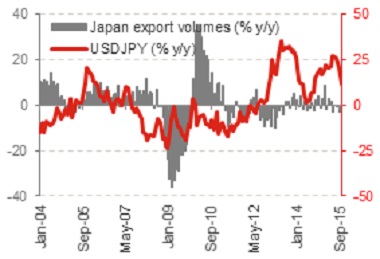
Source: Bloomberg, Momentum Investments
The existence of a still-large negative output gap only compounds the deflation risks that lower energy and food prices have exerted.
Emerging markets (EM)
Growth downgrades likely on muted global trade, slowing domestic demand and tighter financial conditions
Export growth has performed poorly for a number of EMs, while the terms-of-trade (export prices relative to import prices) dynamics have flat-lined across most of these regions. Poor sentiment clouding the outlook for the Chinese economy has had a negative impact on commodity prices, driving export expectations (for commodity-producing nations in particular) weaker.
Internal drivers of EM growth have also softened. Momentum in both capital expenditure and consumer spend has rolled over significantly in recent quarters. Going forward, the expectation of stable-to-marginally higher rates in much of EM-ex Asia and a slight move up in inflation is unlikely to support domestic demand, while the fiscal stance in these economies continues to tighten.
Chart 4: EM 2016 real GDP growth downgrades (%)
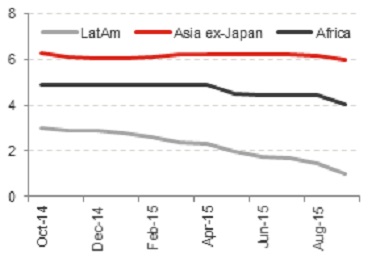
Source: Bloomberg, Momentum Investments, data up to Sept 2015 LatAm= Latin America
Local economic developments
Low growth and the R63.9 billion overrun in the public sector wage bill pose risks to medium-term fiscal consolidation
Although firmer-than-expected personal income tax (PIT) and VAT collections leaves year-to-date fiscal revenues on track, downgraded growth prospects and a higher compensation bill have deferred Treasury’s fiscal consolidation timeline. Using government’s (slightly too optimistic, in our view) forecasts on tax revenue collections and a forecasted average real growth rate of 2.5% in non-interest expenditure, the consolidated budget deficit is expected to narrow from 3.8% to GDP in FY2015/16 (previously estimated at 3.9% in the February 2015 National Budget) to 3.2% in FY2017/18 (revised from 2.5%).
Chart 5: Fiscal consolidation at risk of being delayed
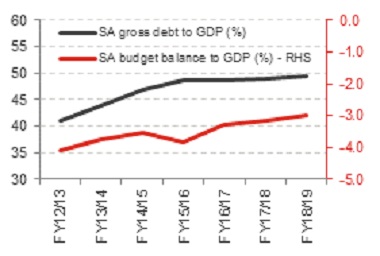
Source: SARB, Global Insight, Momentum Investments
In our view, in the absence of any tax proposals, there is scope for PIT and VAT to disappoint in the upcoming fiscal year as downtrodden consumer confidence, less favourable real wage growth (due to rising inflation), a bleak employment backdrop and soft growth in credit continue to weigh negatively on consumer spend.
Moreover, a subdued commodity price and muted growth environment suggests that corporate profitability will remain under pressure resulting in a drag on corporate taxes. As a result, the path towards fiscal consolidation could be delayed yet again (see chart 5).
Financial market performance
Global markets
Despite cuts to global growth forecasts, world stock markets rallied sharply over October as market participants betted on the increased likelihood of further stimulus from central banks in response to growth concerns. Moreover, an increase in risk appetite could be observed in the c.10-point fall in the CBOE volatility index over the course of the month.
The MSCI World Index rose by 7.9% in October, with the Eurostoxx 50 posting the strongest performance amongst the major developed equity markets (10.4%). This was followed by a firm 7.1% increase in the MSCI Emerging Markets Index despite a largely sideways movement (-0.4%) in the Bloomberg commodity price index over the corresponding period. Asian equity bourses continued to rally sharply with the MSCI Asia Index rising by 7.8% over the month.
Local markets
The South African equity market (FTSE/JSE ALSI) followed the rally in global markets, increasing by a solid 7.6% in October (see chart 6). The FTSE/JSE Industrials Index was the key outperformer, increasing by 8.1%, while the FTSE/JSE Financials Index and the FTSE/JSE Resources Index gained 6.9% and 5.9%, respectively. Both the FTSE/JSE Mid- and Small-caps indices gained over the month, increasing by 6.3% and 5.2%, respectively.
The ALBI moved up by a marginal 1.3% in October, while inflation-linked bonds fared slightly better, increasing by 2.0% for the month. Listed property returns were 2.1% higher in October, while cash returns amounted to 0.5% over the corresponding period.
A higher-than-expected GDP print out of China and delayed Federal Reserve interest rate hike expectations drove emerging market currencies firmer over October. The rand strengthen by 0.2% and 1.6% against the US dollar and euro over the past month, respectively.
Chart 6: Local asset class returns
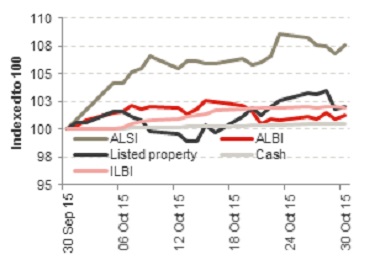
Source: Bloomberg, INET BFA, Momentum Investments
