
4Q15 Labour Force Survey - SA job market remains weak

Sanisha Packirisamy, Economist at MMI Holdings.

Herman van Papendorp, Head of Asset Allocation at MMI Holdings.
According to Stats SA’s Quarterly Labour Force Survey (QLFS), total unemployment increased by 284 000 to 5.2 million over the course of 2015.
Number of unemployed persons rises by 284 000 in 2015
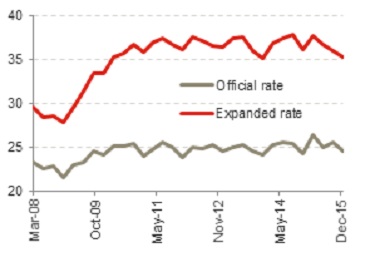
If one includes the number of discouraged work-seekers in SA (those who have given up looking for employment opportunities for a period longer than four weeks), the total jumps to 7.5 million. Although the number of discouraged work seekers remains high in SA, the figure drifted lower from 2.4 million in 4Q14 to 2.3 million in 4Q15. As a result, SA’s so-called expanded rate of unemployment (taking discouraged workers into account) dipped from 36.1% in 4Q14 to 35.2% in 4Q15 even though the official unemployment rate ticked higher from 24.3% to 24.5% over the corresponding period (see chart 1).
Chart 1: SA’s expanded rate of unemployment much higher than the official rate (%)
Source: Global Insight, Momentum Investments
Job creation struggling in primary and secondary sectors of the economy
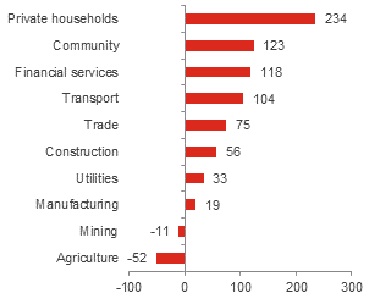
The number of employed workers increased by 698 000 over 2015, which lifted the total number of employed persons to 16 million in 4Q15. While weak commodity prices, labour unrest and drought effects have hampered job creation in the agriculture (-52 000), mining (-11 000) and manufacturing (+19 000) sectors, notable gains were realised in the private households (including domestic workers and gardeners, +234 000), government (+123 000) and financial services (+118 000) sectors (see chart 2).
Chart 2: Change in employment by sector in 2015 (‘000’s)
Source: Global Insight, Momentum Investments
Unemployment rate highest for Black, less educated, youth groups
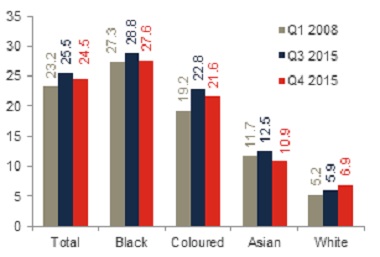
Unemployment rates remained highest for the Black (27.6% in 4Q15 from 28.8% in 3Q15) and Coloured (21.6% in 4Q15 from 22.8% in 3Q15) populations and lowest for the Asian (10.9% in 4Q15 from 12.5% in 3Q15) and white populations (6.9% in 4Q15 from 5.9% in 3Q15). Since 1Q08, the largest deterioration in the unemployment rate has been in the Coloured and White racial groupings, while the headline unemployment rate for the Black population remains broadly in line with 1Q08 levels (see chart 3).
Chart 3: Unemployment rate by racial grouping (%)
Source: Global Insight, Momentum Investments
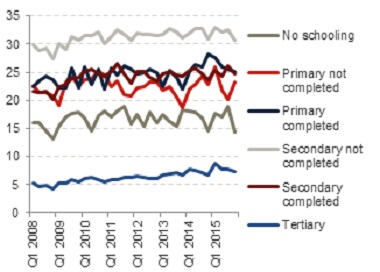
Unemployment rates were highest for those who did not complete secondary schooling at 30.7% (see chart 4) and lowest for those with a tertiary education (7.3%). Nonetheless, unemployment rates today are 2% higher for those with a tertiary education than they were in 1Q08, suggesting less favourable hiring conditions in the post-crisis environment even for those with a higher level of education. The unemployment rate for those with no schooling is currently lower than where it ranked in 2008. This trend appears to correspond with employment data on an occupational split, which shows reasonable growth in low-skilled, elementary jobs since 4Q10 (see chart 5)
Chart 4: Unemployment rate by education level (%)
Source: Global Insight, Momentum Investments, data up to 4Q15
Chart 5: Change in employment by occupation (‘000s)
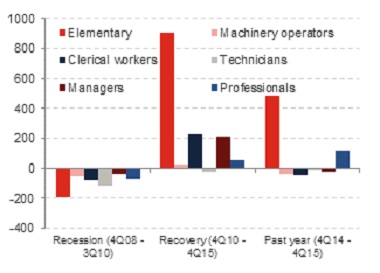
Source: Global Insight, Momentum Investments, data up to 4Q15
Public sector headcount freeze threatens employment outlook
Financial services and government have been the largest job-creating sectors since the global financial crisis (GFC). Over 2.3 million jobs have been created since the trough in employment following the GFC, exceeding the 1.1 million lost during the crisis. Since the trough in employment, government has hired 819 000 workers, making up the bulk of employment gains since 3Q10. This was followed by job creation in the financial services (+ 585 000) and construction (+320 000) sectors, while the manufacturing industry continued to shed jobs, losing up to 77 000 workers since 3Q10 (see chart 6).
Employment creation since the GFC has largely been attributable to healthy jobs growth in the public sector. Rising fiscal pressures have forced government to limit compensation budgets while requiring greater efficiency from public servants. In order to operate within budget limits, appointments to non-critical posts will be blocked on government’s payroll system, while government aims to reduce personnel headcount in administrative and managerial posts.
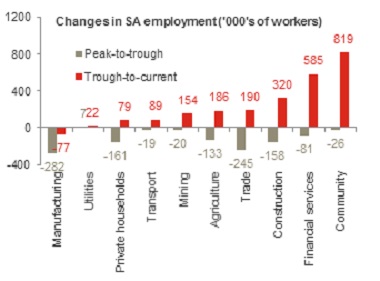
Source: Global Insight, Momentum Investments
This implies that the private sector will increasingly be relied on to shoulder the burden of job creation. However, against a fragile growth backdrop and an uncertain policy environment, we do not expect a sharp acceleration in private sector employment growth. The Bureau of Economic Research’s sector surveys point to weak employment growth across the economy with the exception of financial services which could see mild employment growth over upcoming quarters (see chart 7). As such, we could see employment creation remain under pressure this year. In addition to rising interest rates, elevated debt levels, slow household credit growth and depressed consumer sentiment, muted jobs growth will likely keep household consumption expenditure under pressure this year and next. In particularly, we expect momentum in non-discretionary spend (including outlays on passenger vehicles and furniture) to soften further.
Chart 7: Dismal employment outlook
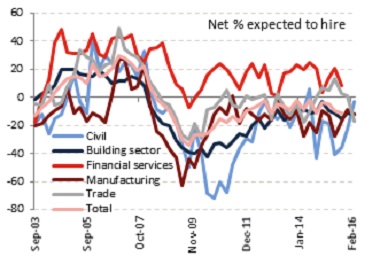
Source: BER, Momentum Investments
